The coffee industry is changing so much from year to year that facts and statistics often look completely different from one year to the next.
Instead of providing old or irrelevant data for reference and sharing, we regularly update our research.
We have mentioned all the important data for 2020 in the following article:
Coffee Industry Statistics
- Coffee Consumption
- Drinks Statistics
- Why People Drink Coffee
- Caffeine Consumption
- Coffee Production
- Export and Import
- Coffee Shop Statistics
- Coffee Industry Revenue Statistics
Coffee Industry Consumption Statistics
1. In 2019, 64% of Americans aged 18 and over drank coffee every day. (NCA)
2. Worldwide, approximately 54% of adults between the ages of 18 and 29 drink, on average, 2 cups a day. (SurveyMonkey)
3. More than 2.25 billion cups of coffee are drunk every day around the world. (Wikipedia)
4. Also, Americans consume more than 140 billion cups per year, or about 400 million cups of coffee per day. (Fool.com)
5. The average U.S. coffee drinker consumes 2.7 cups per day, with the average size of a coffee cup measuring 9 ounces. (Fool.com)
6. In 2019-2020, 164,487 thousand 60-kg bags of coffee were consumed, and the global consumption growth rate was 2.2% per year. (International Coffee Organization)
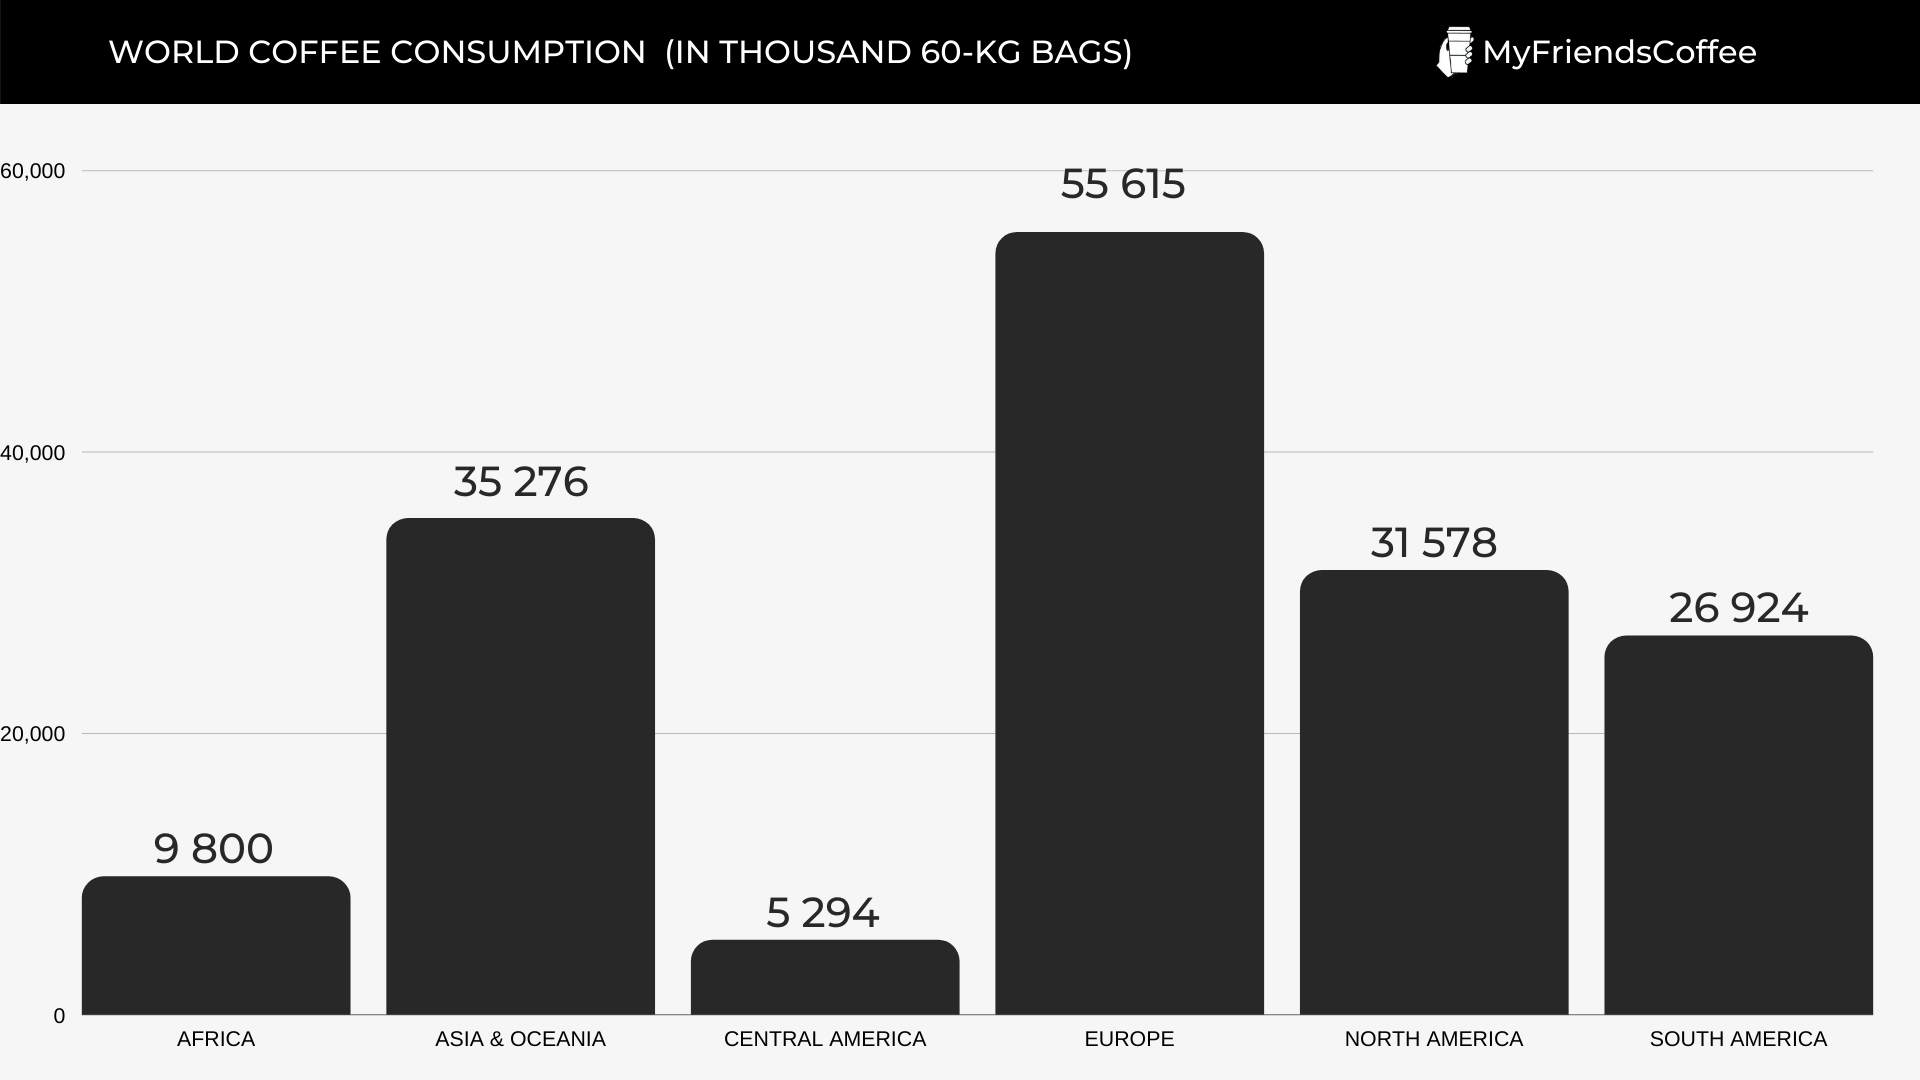
7. World coffee consumption by continent in 2019-2020 (International Coffee Organization):
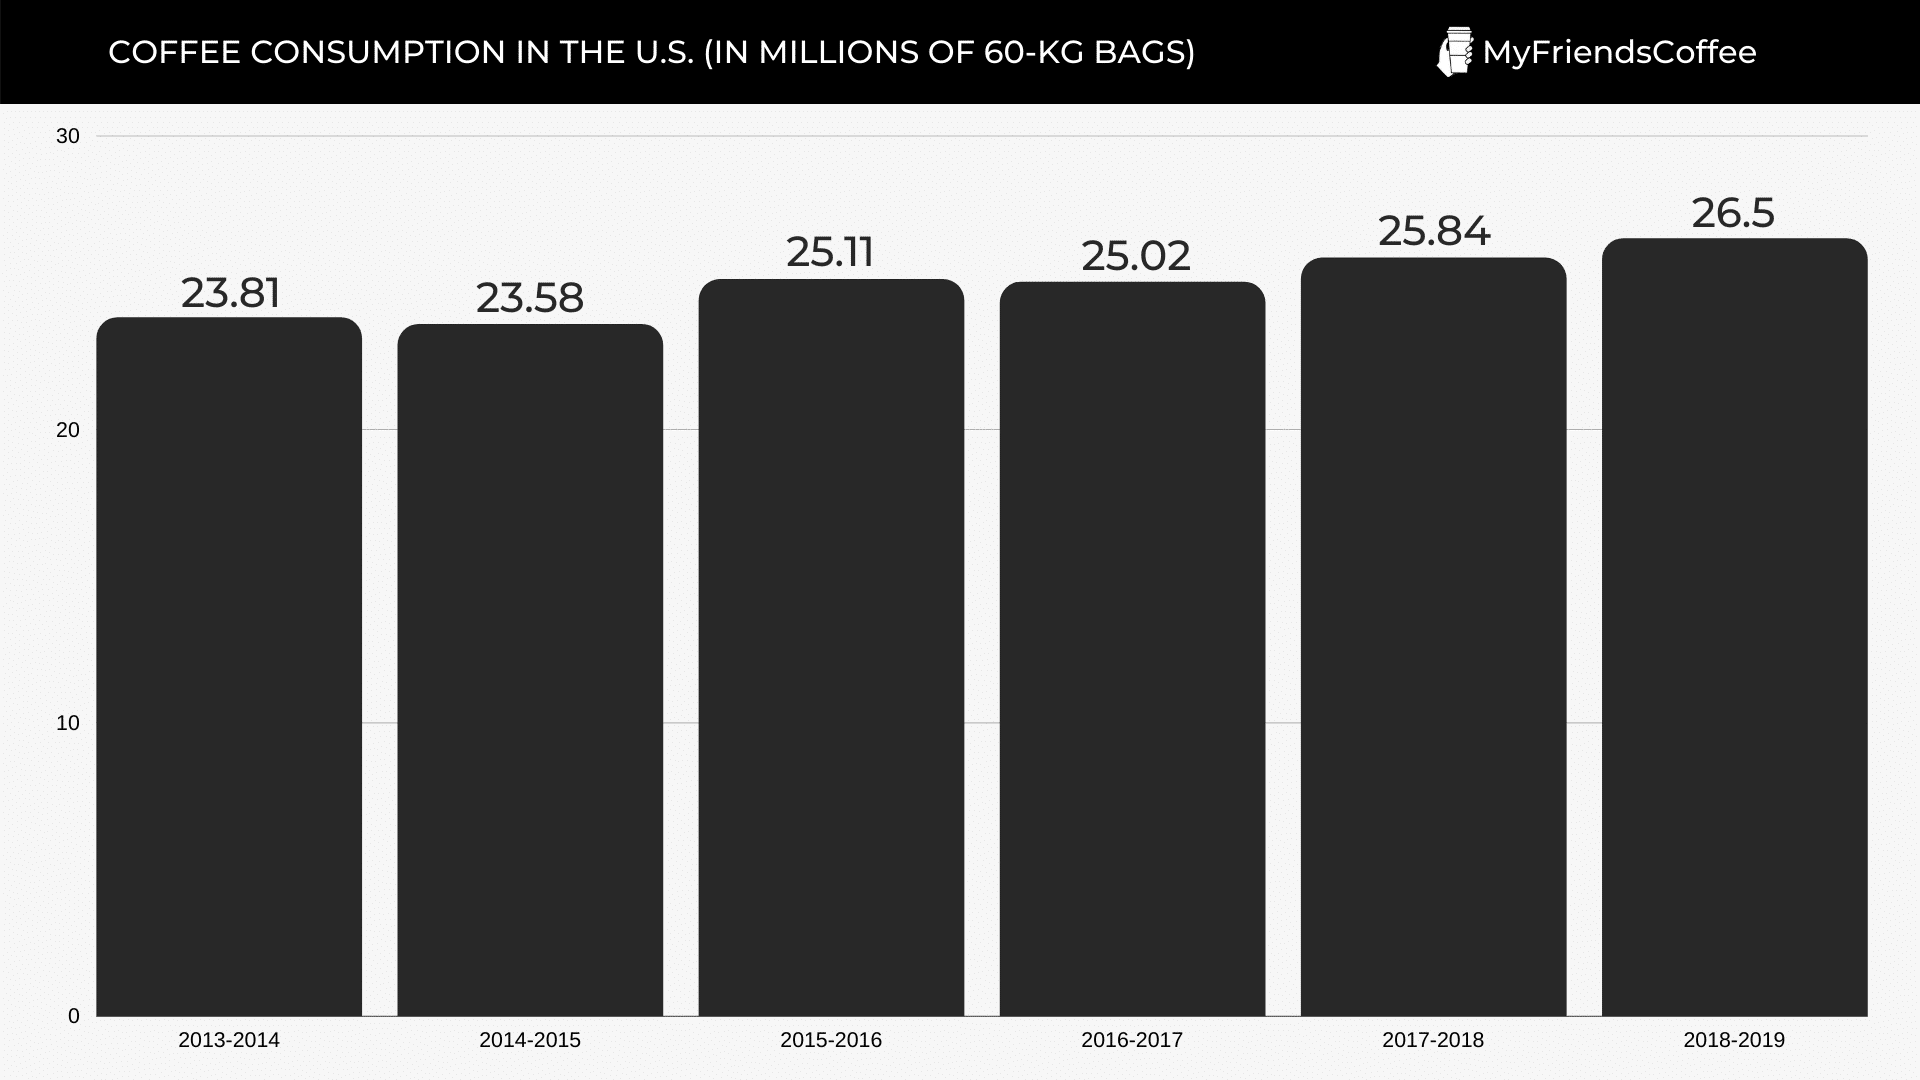
8. Coffee consumption in the U.S. in millions of 60-kg bags (Statista):
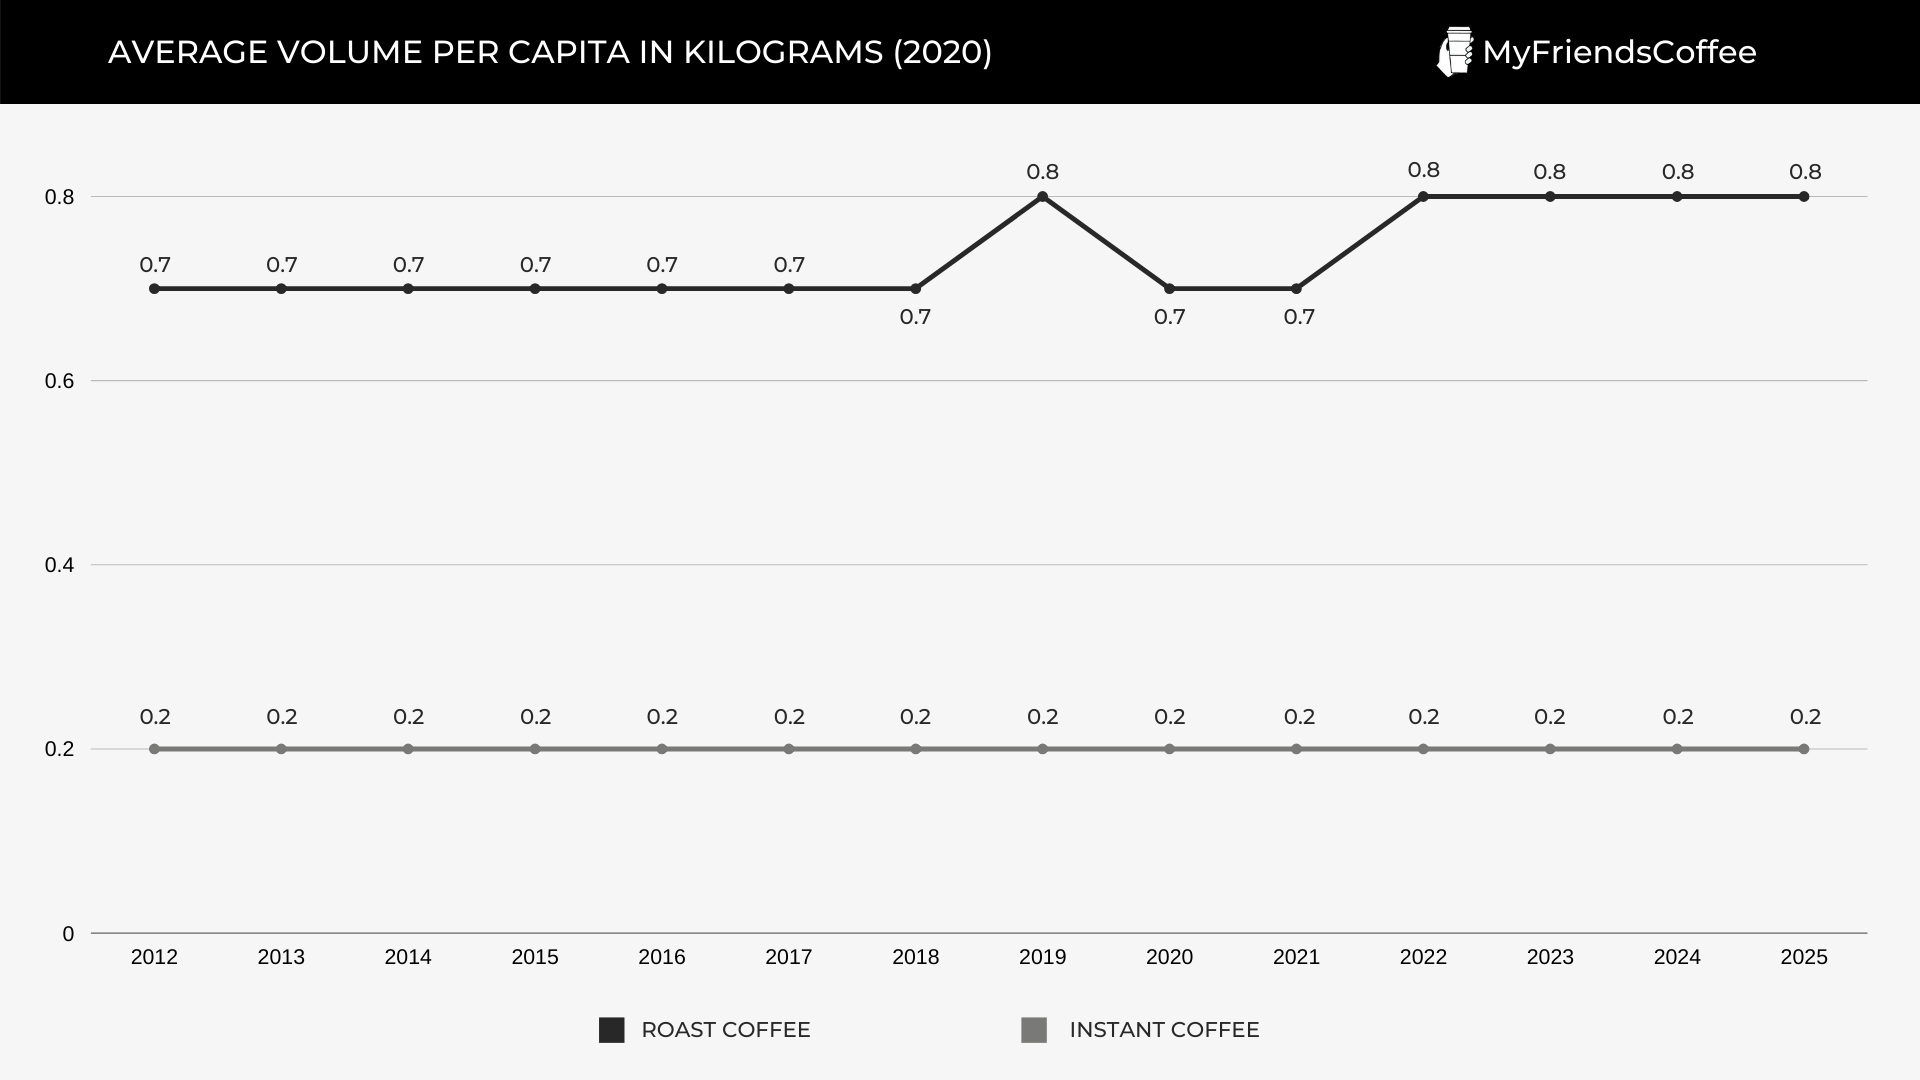
9. In 2020, the average volume of coffee consumed per capita amounts to 0.9 kg. (Statista)
10. Countries that consume the most coffee per capita (WorldAtlas):
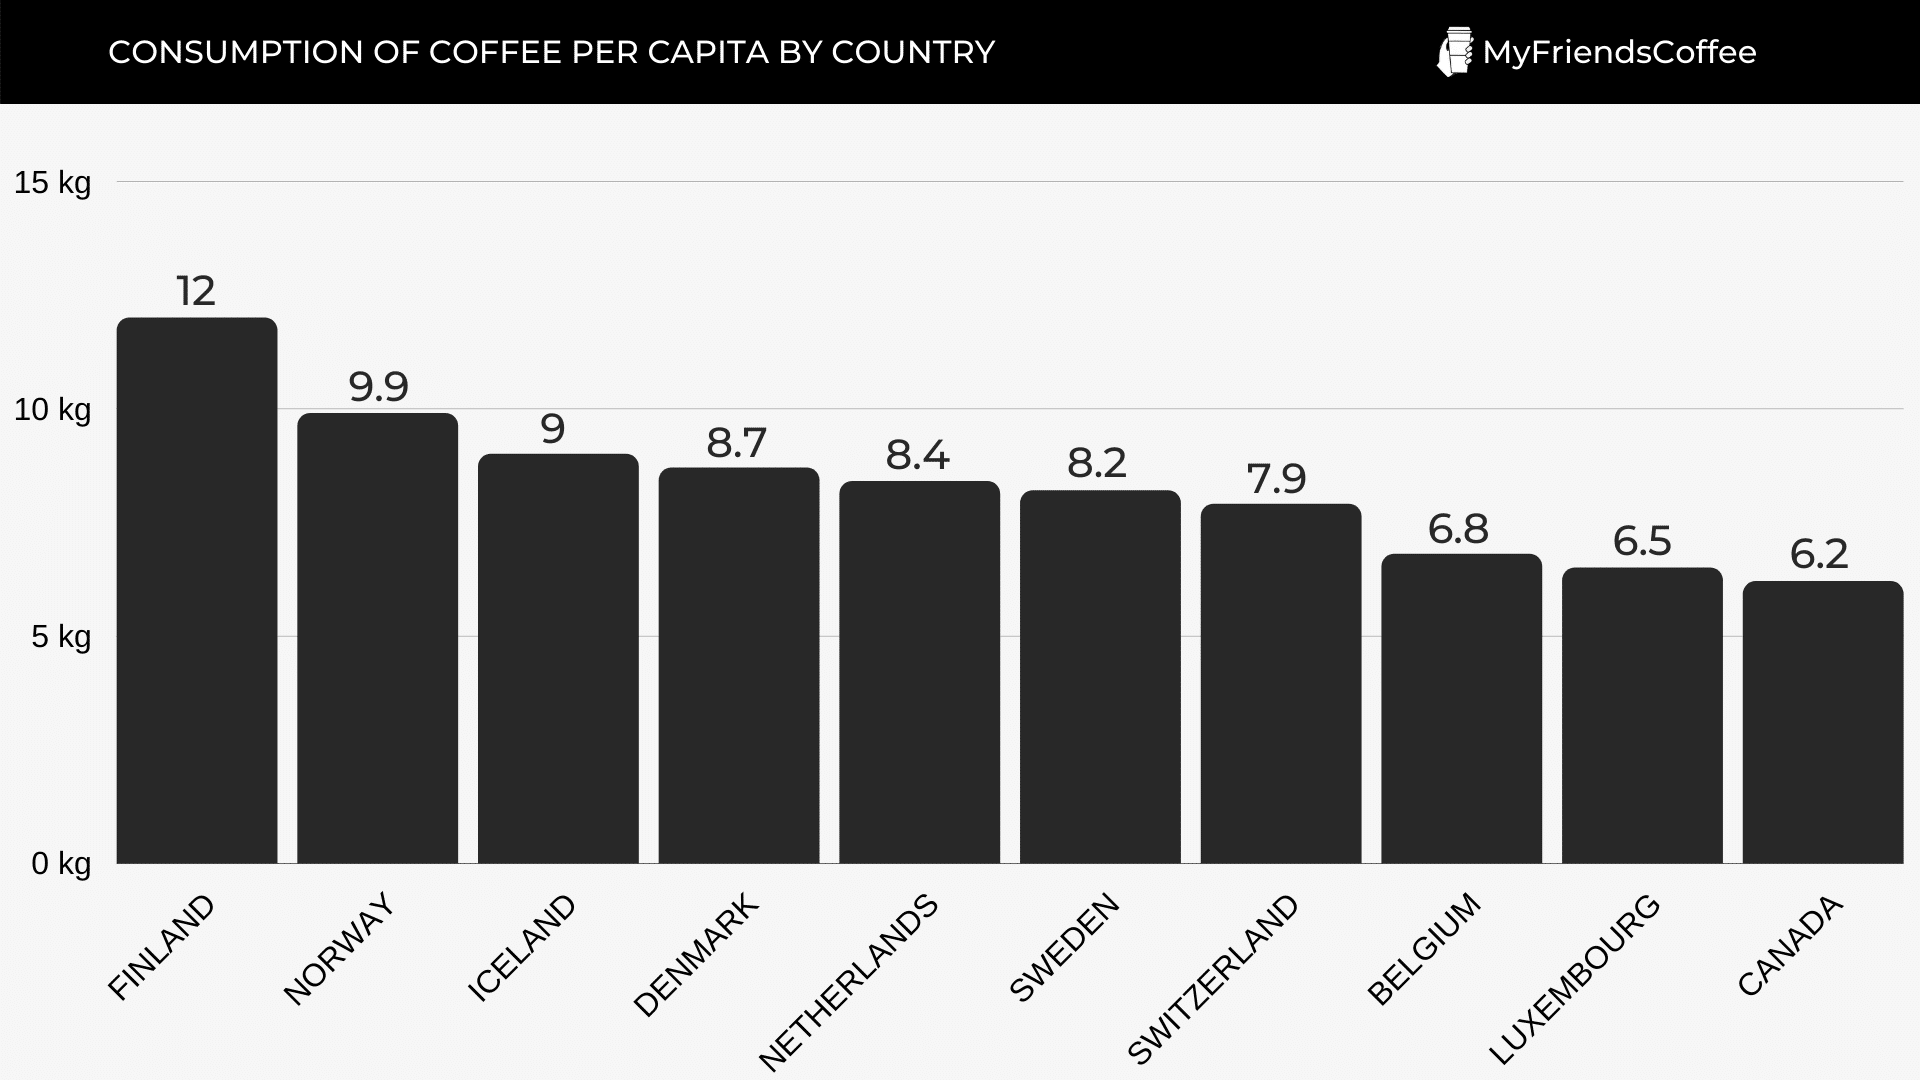
11. In the United States, coffee consumption is 4.2 kg per capita. (WorldAtlas)
12. In the United States, 79% of respondents said they had a cup of coffee at home the previous day, and 36% of Americans said they had a cup of coffee away from home the previous day. (Reuters)
13. The average cost of a cup of coffee varies widely around the world (Statista):
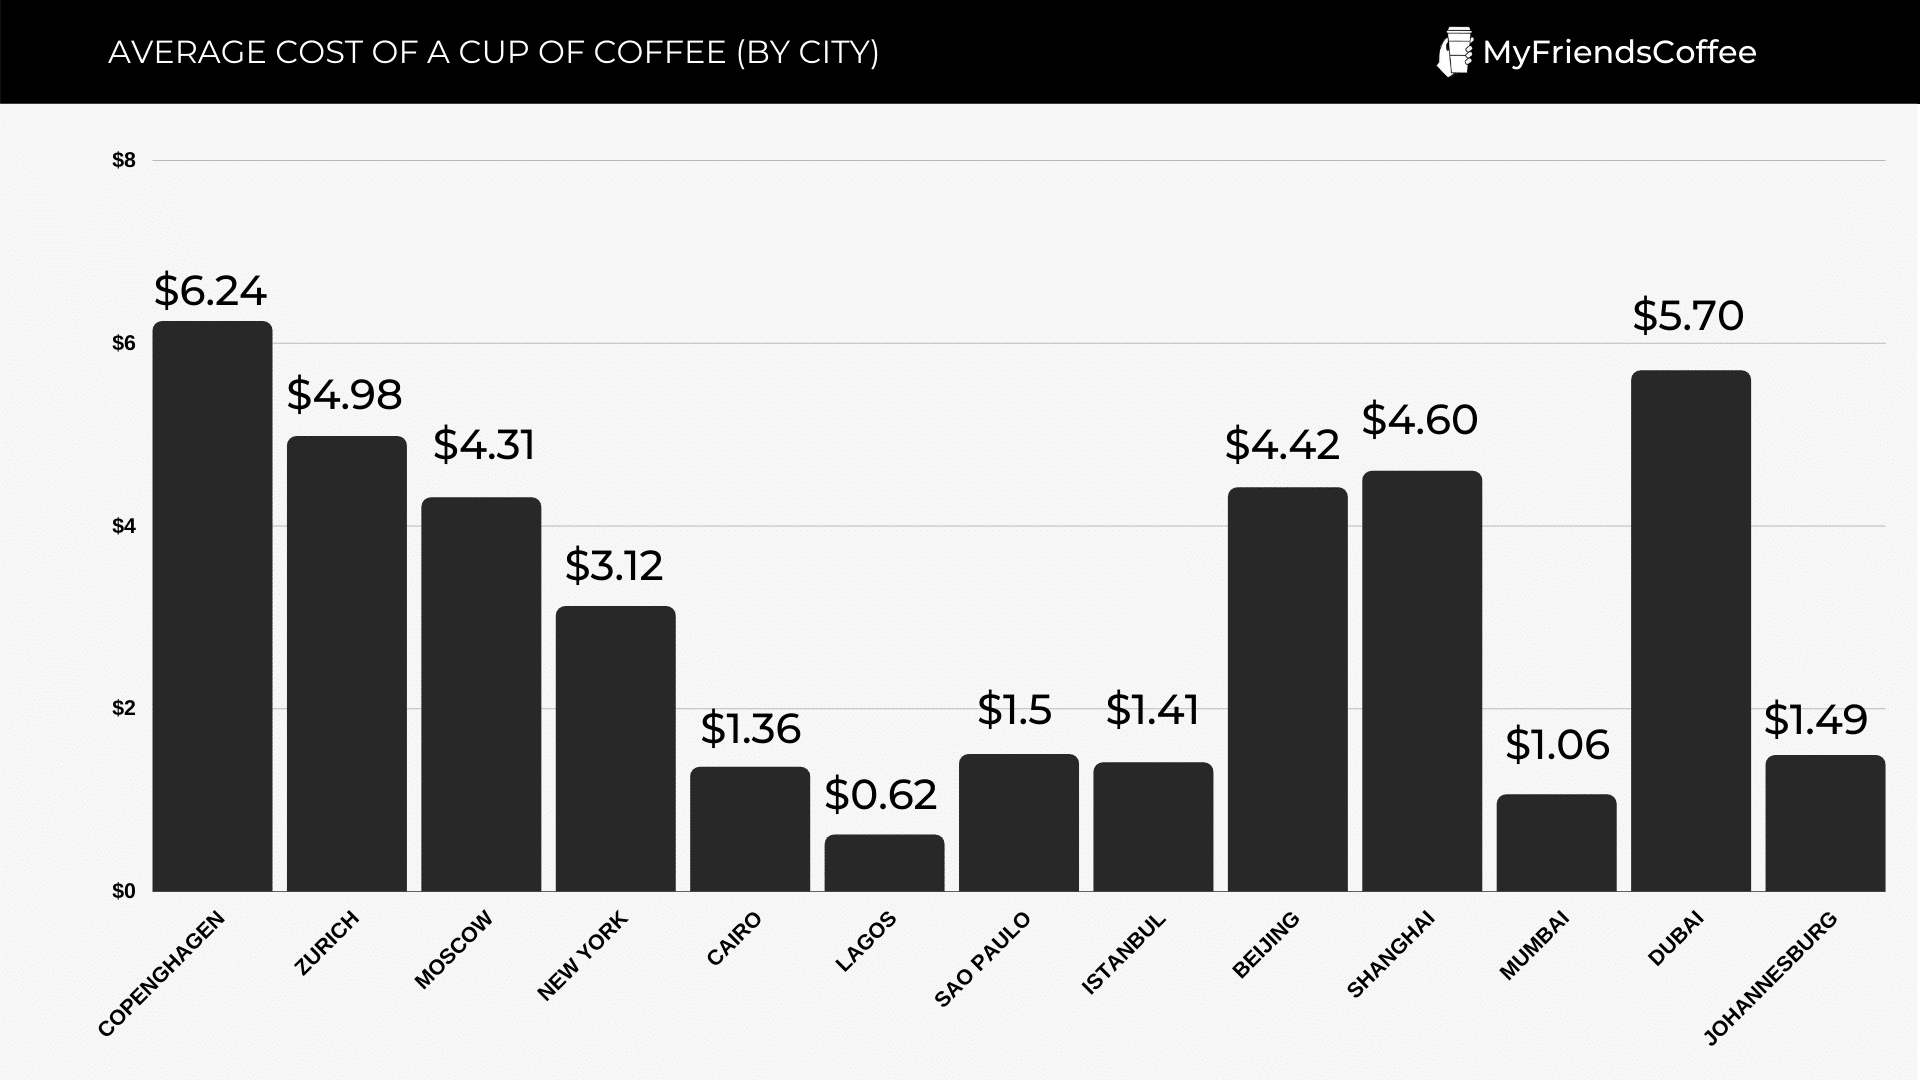
14. The average price of a cup of coffee in the USA across all restaurant categories (quick and full service) is $2.99, compared to Starbucks where customers pay between $1.95 and $2.15 for a tall (12-ounce) brewed coffee, depending on location. (MarketWatch)
15. The average size of a cup of coffee in the USA (Shutterfly):
| Mug Type | Mug Size |
| Espresso | 2-3 oz |
| Cappuccino | 5-6 oz |
| Classic | 8-15 oz |
| Latte | 11-15 oz |
| Oversized Mug | 20-25 oz |
| Oversized Latte | 20-25 oz |
| Travel Tumbler | 15-20 oz |
| Travel Mug | 15-20 oz |
Coffee Industry Drinks Statistics
16. These are the most popular coffee drinks in the world (BeanPoet):
- Americano
- Breve
- Café au lait
- Café mocha
- Cappuccino
17. These are the most popular coffee drinks in the USA (WorkWise):
- Caramel Macchiato
- Flat White
- Cappuccino
- Cold Brew
- Latte Macchiato
Why People Drink Coffee
18. Here are the top reasons people drink coffee (SurveyMonkey):
- 69% of people drink coffee because they like the taste;
- 62% of respondents drink coffee to gain energy;
- 34% drink coffee to focus;
- 18% drink coffee to deal with stress;
- 10% consume coffee for health reasons.
19. People really want coffee! (I Need Coffee):
- 42% would give up the morning newspaper and smartphone for a cup of coffee;
- 20% would exchange a lunch for coffee;
- 12% prefer to get up earlier for a cup of coffee;
- 10% would drink coffee instead of brushing their teeth.
20. They cannot refuse it! (Mandatory):
- 62% of people cannot function without it;
- 41% of people said that they drink coffee in the shower;
- 36% said they were ready to give up TV and the Internet for a week for coffee;
- 29% of people said they were ready to leave their loved ones for a week for coffee;
- 25% would refuse a morning shower for coffee.
21. Millennials have specific coffee preferences (National Coffee Association Blog):
- 70% of the coffee consumed by millennials is gourmet drinks, and 30% is not;
- 32% of millennials consume espresso drinks;
- 14% consume non-espresso drinks;
- 15% of millennils drink coffee in specialized coffee shops and eateries;
- About 65% of Millennials are aware of single-cup brewers, a significantly lower portion than among older age groups.
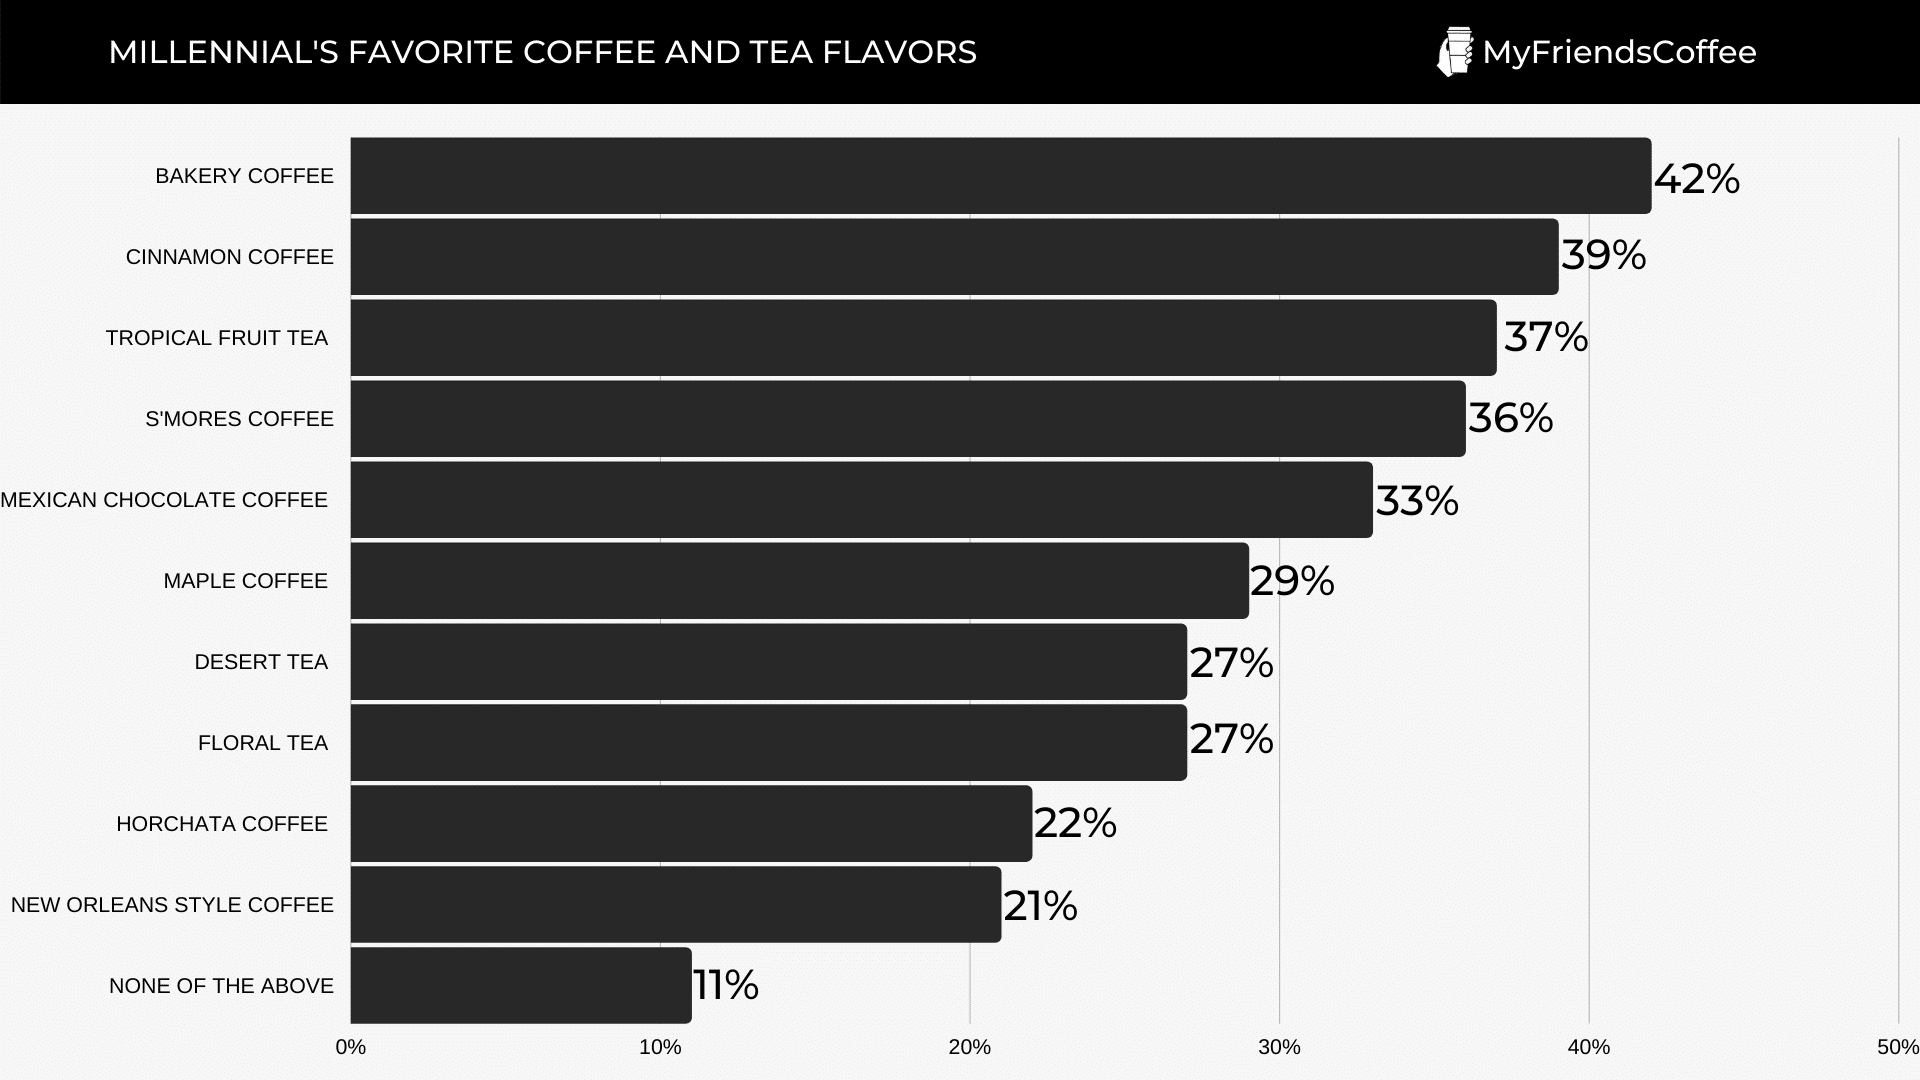
22. Millennials’ favorite coffee and tea flavors (Keurig Blog):
Caffeine Consumption Statistics
23. Caffeine consumption statistics by country (Caffeine Informer):
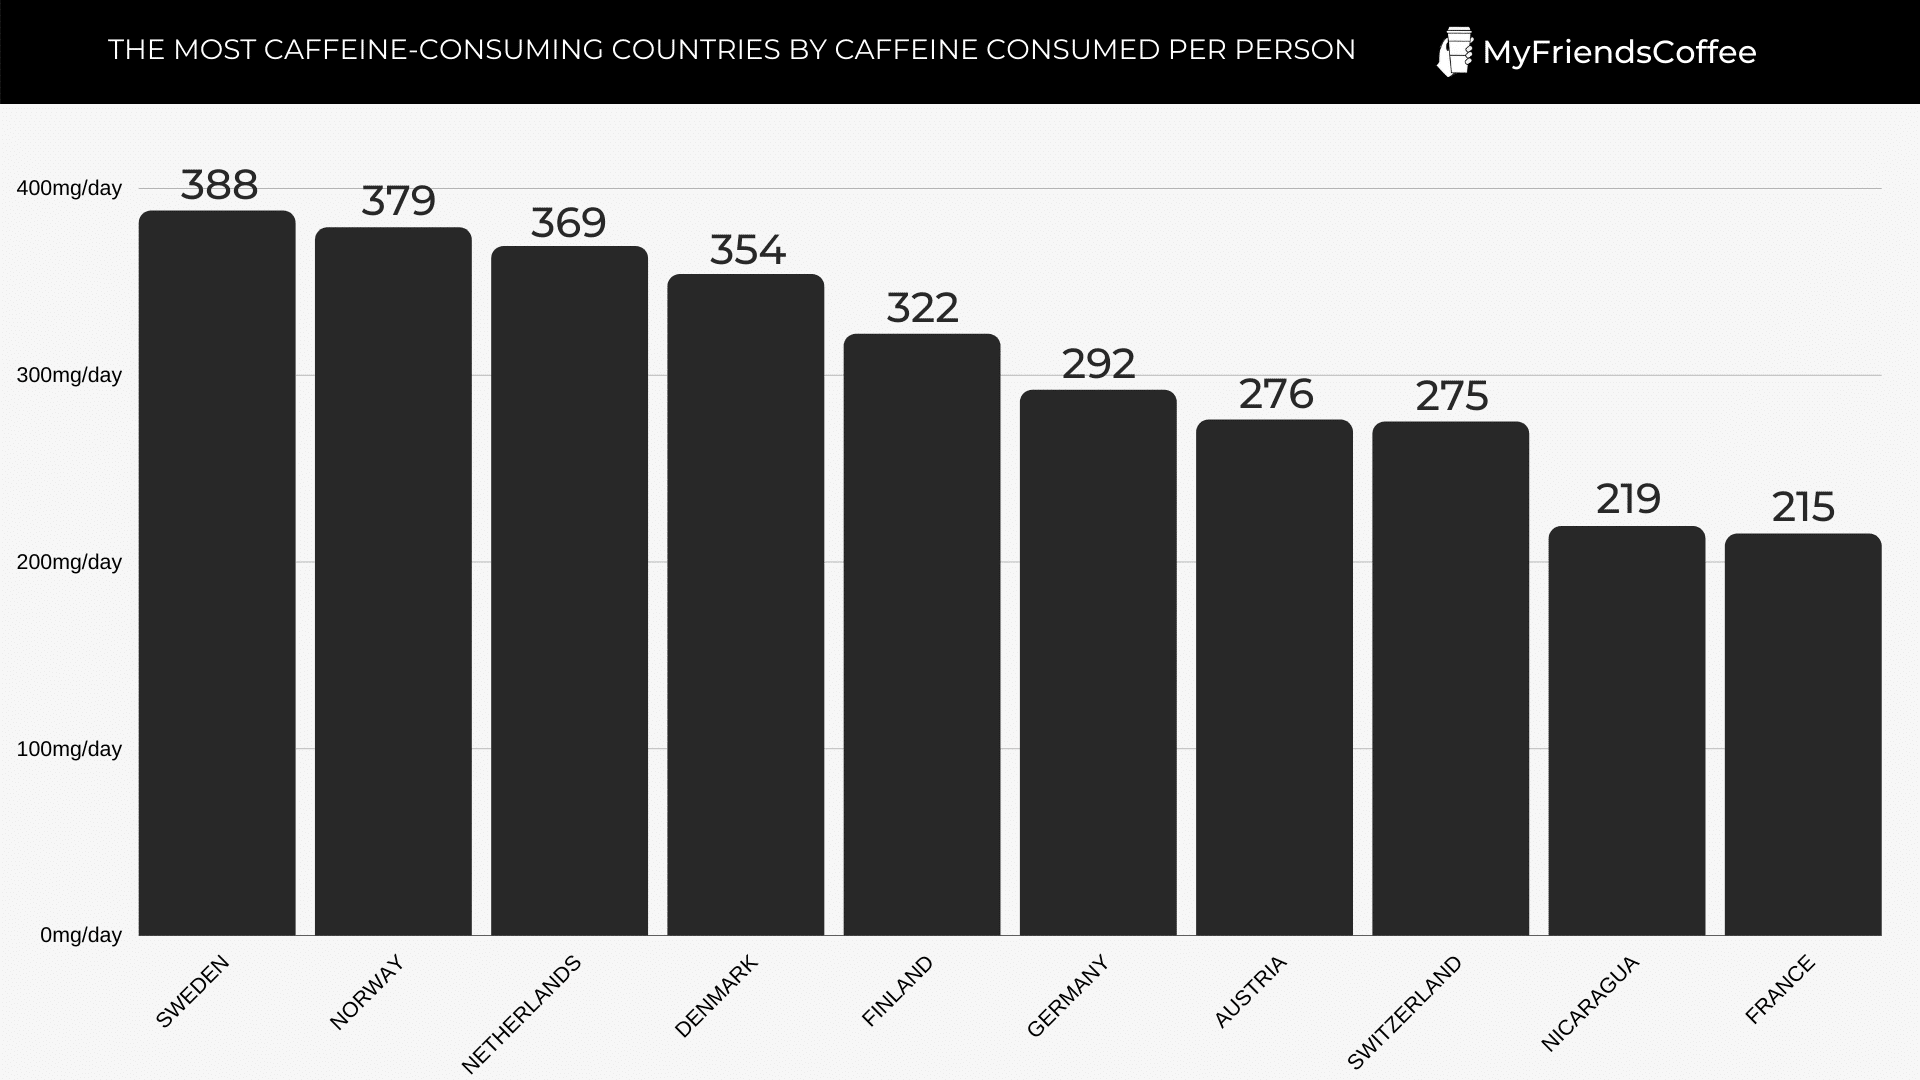
24. The USA ranks 11th among the countries with the highest caffeine consumption, with a rate of 200mg/day per person. (Caffeine Informer)
Coffee Production Statistics
25. In total, world coffee production is estimated to reach 176.1 million 60-kg bags in 2020-2021. (United States Department of Agriculture)
26. Countries with the largest coffee production (Wikipedia, Global Value Chains Center):
| Country | 60-kg bags | Metric Tons | Pounds | Global % |
| Brazil | 44200000 | 2652000 | 5714381000 | 29.1 |
| Vietnam | 27500000 | 1,650,000 | 3637627000 | 18.6 |
| Colombia | 13500000 | 810,000 | 1785744000 | 9.1 |
| Indonesia | 11000000 | 660,000 | 1455050000 | 7.4 |
| Ethiopia | 6,400,000 | 384000 | 846575000 | 4.3 |
| Honduras | 5,800,000 | 348,000 | 767208000 | 3.9 |
| India | 5800000 | 348,000 | 767208000 | 3.9 |
| Uganda | 4800000 | 288000 | 634931000 | 3.2 |
| Mexico | 3900000 | 234,000 | 515881000 | 2.6 |
| Guatemala | 3400000 | 204,000 | 449743000 | 2.3 |
| Peru | 3200000 | 192,000 | 423287000 | 2.2 |
| Nicaragua | 2200000 | 132000 | 291010000 | 1.5 |
| China | 1947000 | 116,820 | 257544000 | 1.3 |
| Ivory Coast | 1,800,000 | 108,000 | 238099000 | 1.2 |
| Costa Rica | 1492000 | 89520 | 197357000 | 1.2 |
| Papua New Guinea | 800000 | 48000 | 105821000 | 1 |
| Tanzania | 800000 | 48000 | 105821000 | 0.6 |
| El Salvador | 762000 | 45,720 | 100795000 | 0.5 |
| Ecuador | 700000 | 42000 | 92594000 | 0.5 |
| Cameroon | 570000 | 34,200 | 75398000 | 0.5 |
| Laos | 520000 | 31,200 | 68784000 | 0.5 |
| Madagascar | 520,000 | 31200 | 68784000 | 0.4 |
| Gabon | 500000 | 30000 | 66138000 | 0.4 |
| Thailand | 500000 | 30000 | 66138000 | 0.4 |
| Venezuela | 500000 | 30000 | 66138000 | 0.3 |
| Dominican Republic | 400000 | 24000 | 52910000 | 0.3 |
| Haiti | 350000 | 21000 | 46297000 | 0.3 |
| Democratic Republic of the Congo | 335000 | 20100 | 44312000 | 0.3 |
| Rwanda | 250,000 | 15000 | 33069000 | 0.2 |
| Burundi | 200,000 | 12000 | 26455000 | 0.2 |
| Philippines | 200000 | 12000 | 26455000 | 0.2 |
| Guinea | 160,000 | 9600 | 21164000 | 0.1 |
| Yemen | 120000 | 7200 | 15873000 | 0.1 |
| Cuba | 100000 | 6000 | 13227000 | 0.1 |
| Panama | 100000 | 6000 | 13227000 | 0.1 |
| Bolivia | 90000 | 5400 | 11904000 | 0.1 |
| Timor Leste | 80000 | 4800 | 10582000 | 0.1 |
| Central African Republic | 65000 | 3900 | 8598000 | 0.1 |
| Nigeria | 40000 | 2400 | 5291000 | 0.1 |
| Ghana | 37000 | 2,220 | 4894000 | 0.1 |
| Sierra Leone | 36000 | 2160 | 4761000 | 0.1 |
| Angola | 35,000 | 2100 | 4629000 | 0.1 |
| Jamaica | 21000 | 1260 | 2777000 | 0.1 |
| Paraguay | 20000 | 1200 | 2645000 | 0.1 |
27. Flavors of coffee by country (Duke Global Value Chains Center, Wikipedia, Perfect Daily Grind, USAID, International Trade Centre, Roastmasters, Sweet Marias, Sierra Leone Telegraph):
| Country | Flavor |
| Brazil | Chocolate, nutty, savory |
| Vietnam | Earthy, bitter |
| Colombia | Cola, cherry, orange, vanilla, chocolate |
| Indonesia | Earthy, woody |
| Ethiopia | Blueberry, citrus, floral |
| Honduras | Chocolate, nutty, savory |
| India | Eathy, spicy, clove |
| Uganda | Earthy, floral, savory |
| Mexico | Chocolate, nutty, savory |
| Guatemala | Chocolate, nutty, savory |
| Peru | Nutty, vanilla |
| Nicaragua | Tobacco |
| China | Earthy, balanced |
| Cote d’Ivoire | Earthy, bitter |
| United States | Earthy, woody |
| Costa Rica | Chocolate, nutty, savory |
| Kenya | Dried fruit, raisin |
| Papua New Guinea | Earthy, woody |
| Tanzania | Fruity, berry, cedar |
| El Salvador | Chocolate, nutty, savory |
28. About 70% of the world’s coffee production is Arabica, nearly 30% is Robusta and only about 2% is Liberica. (National coffee Association, Universiti Kebangsaan Malaysia)
29. Global production of Arabica/Robusta/Liberica in percent by country (Global Values Chains Center):
| Country | Arabica | Robusta | Liberica |
| Brazil | 74 | 26 | 0 |
| Vietnam | 11 | 89 | 0 |
| Colombia | 100 | 0 | 0 |
| Indonesia | 24 | 75 | 1 |
| Ethiopia | 54 | 46 | 0 |
| Honduras | 91 | 9 | 0 |
| India | 28 | 72 | 0 |
| Uganda | 11 | 89 | 0 |
| Mexico | 96 | 4 | 0 |
| Guatemala | 98 | 2 | 0 |
30. Comparison of characteristics of coffee tree varieties (Wikipedia, Roast and Reason, Useful Tropical Plants, Pinoy Bisnes Ideas, Kape Isla, Food-Info, World Fertilizer Use Manual, Trade Winds Fruit, EnjoyJava, International Coffee Trading, Vittoria Coffee):
| Feature | Arabica | Robusta | Liberica |
| Global Production | ~70% | ~30% | ~2% |
| Primary Production | South America | Africa | Asia |
| Bearing Age | 2 years | 3-4 years | 3-5 years |
| Height | 10-15 feet | 15-30 feet | 30-45 feet |
| Temperature | 60-75F | 65-95F | 60-80F |
| Elevation | 2,000-6,500 feet | Sea level to 3,000 feet | Sea level to 3,000 feet |
| Shade | More | Less | Less |
| Rainfall | 45-85 inches | 85-115 inches | 65-100 inches |
| Yield | 0.7-2.2 lbs per tree | 1.2-2.4 lbs per tree | 1.2-2.4 lbs per tree |
| Harvest After Flowering | 7-9 months | 9-11 months | 12-14 months |
| Density Per Hectare | 1,200-7,000 | 500-2,000 | 500-2,000 |
| Pollination | Self pollinating | Cross pollination | Cross pollination |
| Pest Resistence | Low | High | Medium |
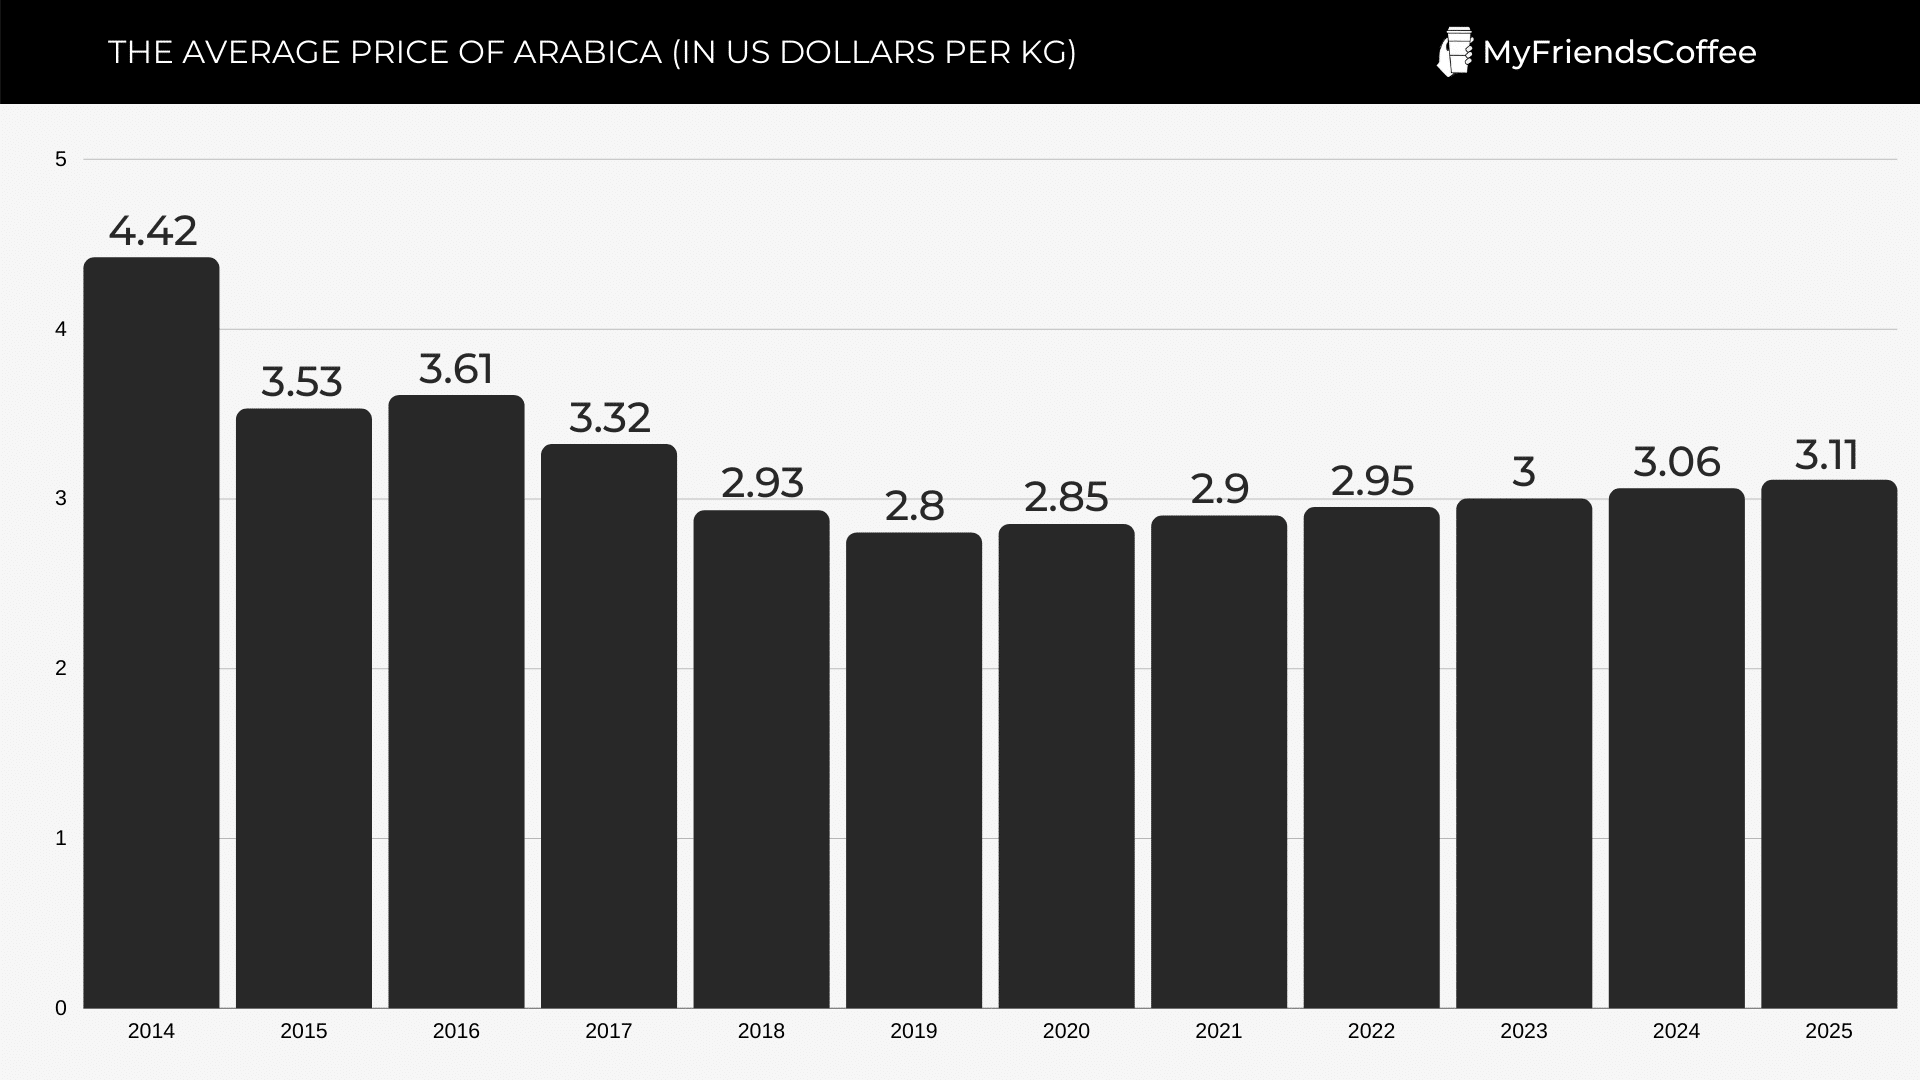
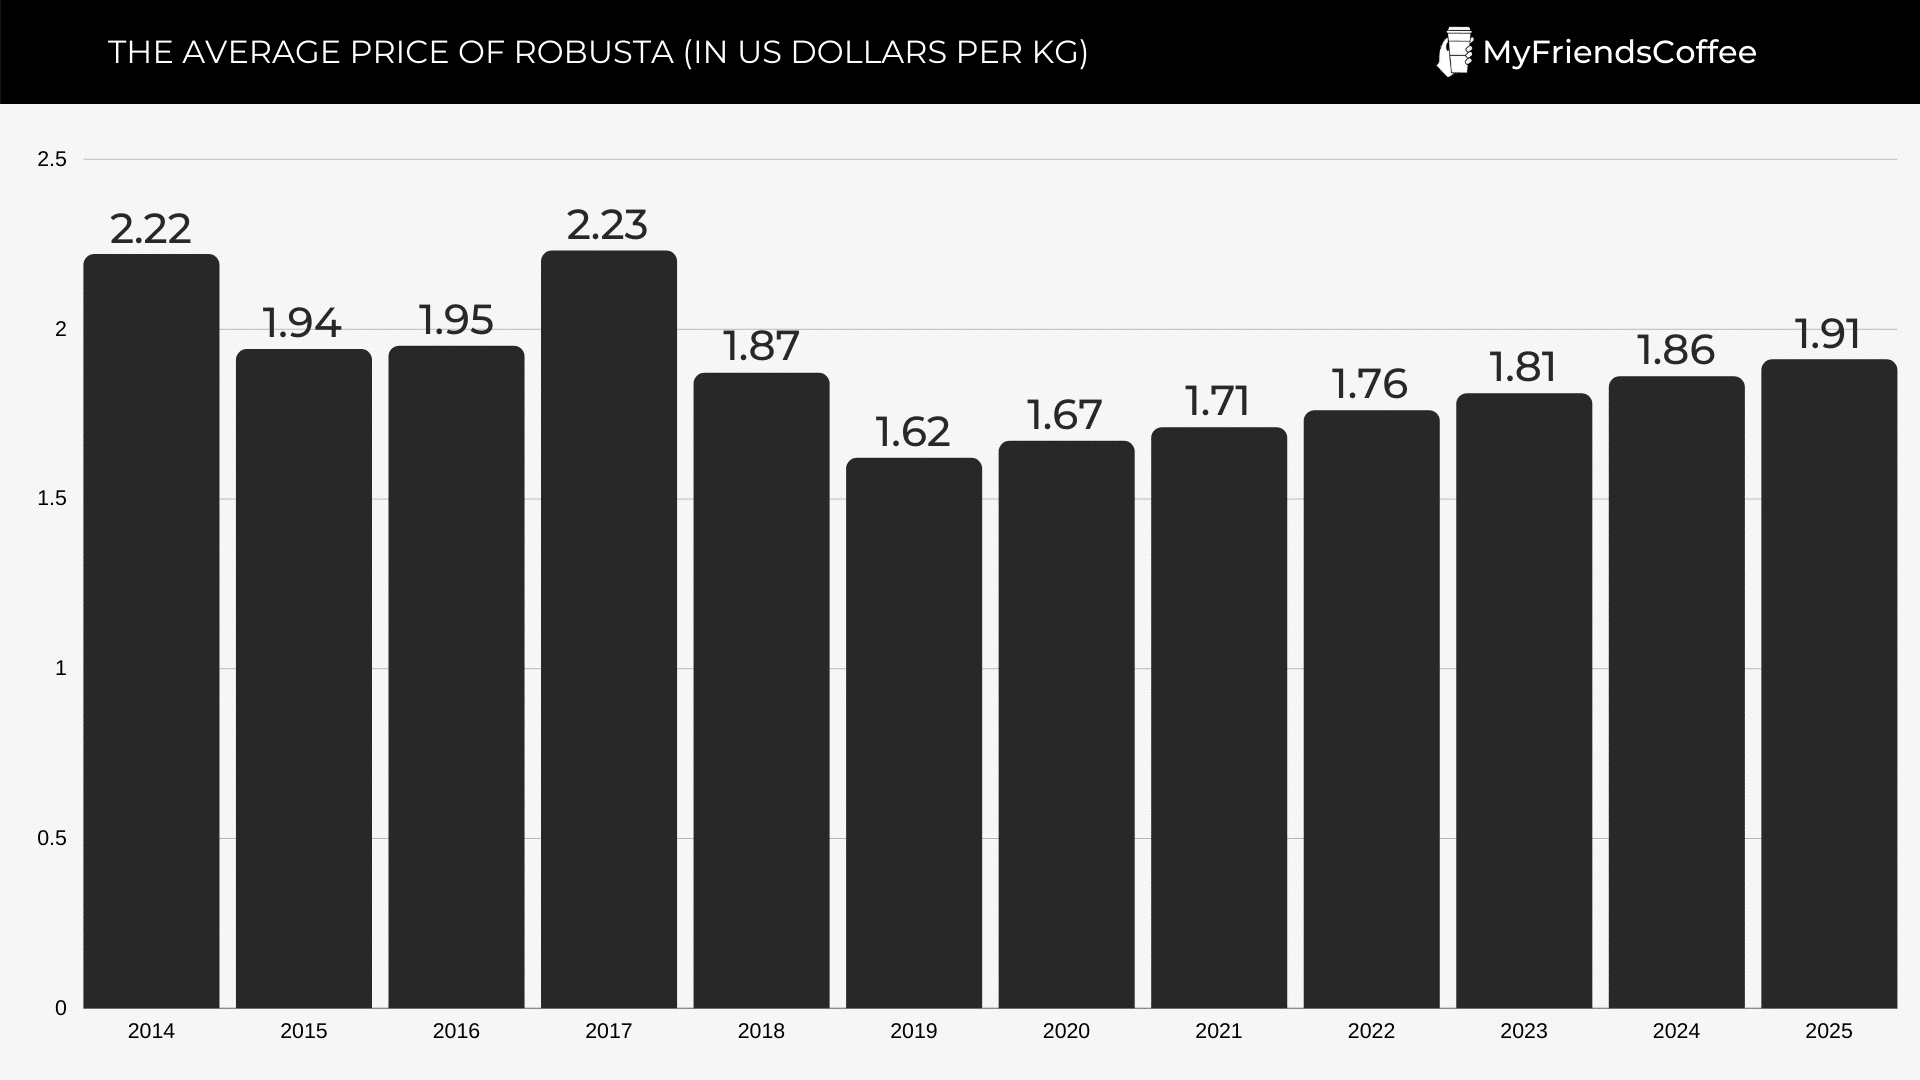
31. The average price of Arabica and Robusta in US dollars per kilogram (Statista):
32. Nearly 25 million farmers worldwide rely on growing coffee for their livelihood. (HowStuffWorks)
Coffee Export and Import Statistics
33. These countries comprise 79.7% of the world’s coffee exports (World’s Top Exports):
| Feature | Arabica | Robusta | Liberica |
| Global Production | ~70% | ~30% | ~2% |
| Primary Production | South America | Africa | Asia |
| Bearing Age | 2 years | 3-4 years | 3-5 years |
| Height | 10-15 feet | 15-30 feet | 30-45 feet |
| Temperature | 60-75F | 65-95F | 60-80F |
| Elevation | 2,000-6,500 feet | Sea level to 3,000 feet | Sea level to 3,000 feet |
| Shade | More | Less | Less |
| Rainfall | 45-85 inches | 85-115 inches | 65-100 inches |
| Yield | 0.7-2.2 lbs per tree | 1.2-2.4 lbs per tree | 1.2-2.4 lbs per tree |
| Harvest After Flowering | 7-9 months | 9-11 months | 12-14 months |
| Density Per Hectare | 1,200-7,000 | 500-2,000 | 500-2,000 |
| Pollination | Self pollinating | Cross pollination | Cross pollination |
| Pest Resistence | Low | High | Medium |
34. The fastest growing coffee exporters since 2015 (World’s Top Exports):
- France (an increase of 74.8%);
- Netherlands (an increase of 57.2%);
- Italy (an increase of 24.7%);
- Switzerland (an increase of 24.2%).
35. Reducing the volume of coffee exports by country (World’s Top Exports):
- Indonesia (-26.6% decrease);
- Belgium (-19.9% decrease);
- Brazil (-18.2% decrease);
- USA (-13.2% decrease);
- Vietnam (-0.04% decrease).
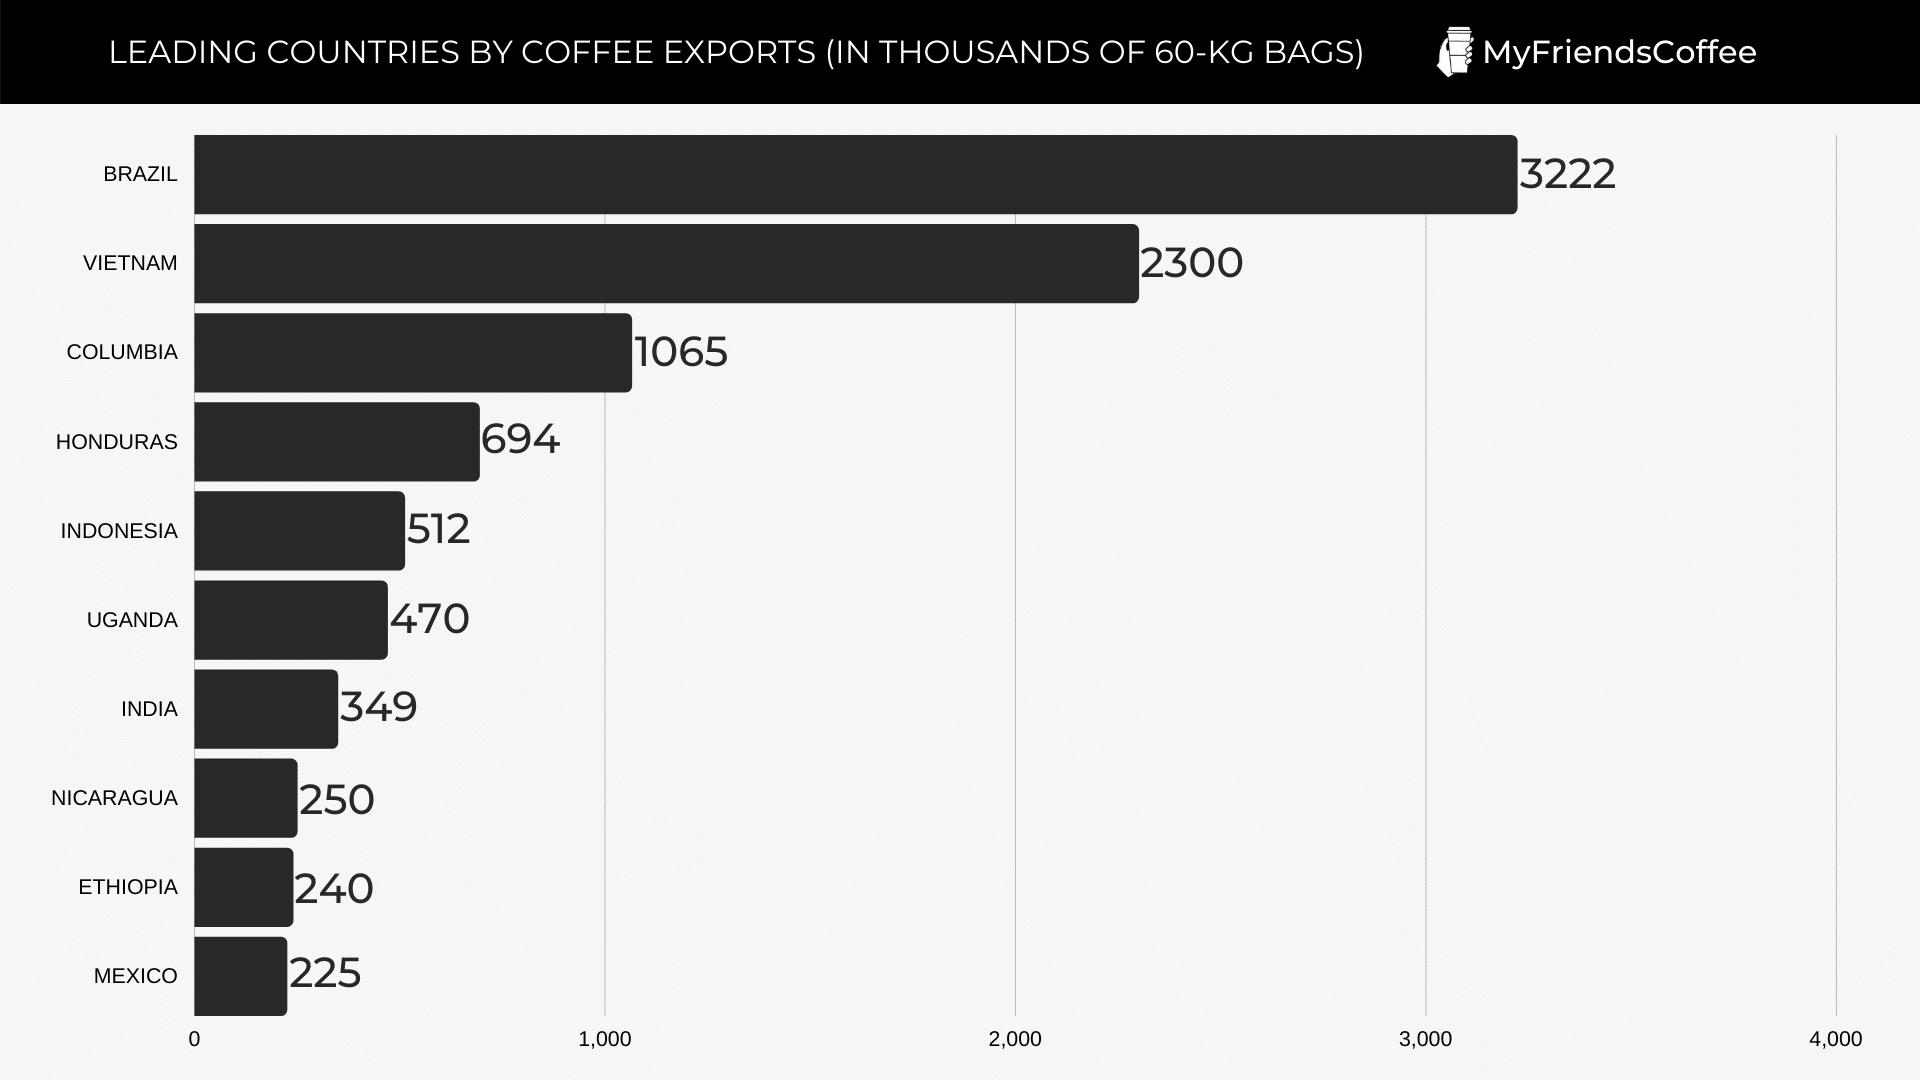
36. Leading countries by coffee exports, in thousands of 60-kilogram sacks (Statista):
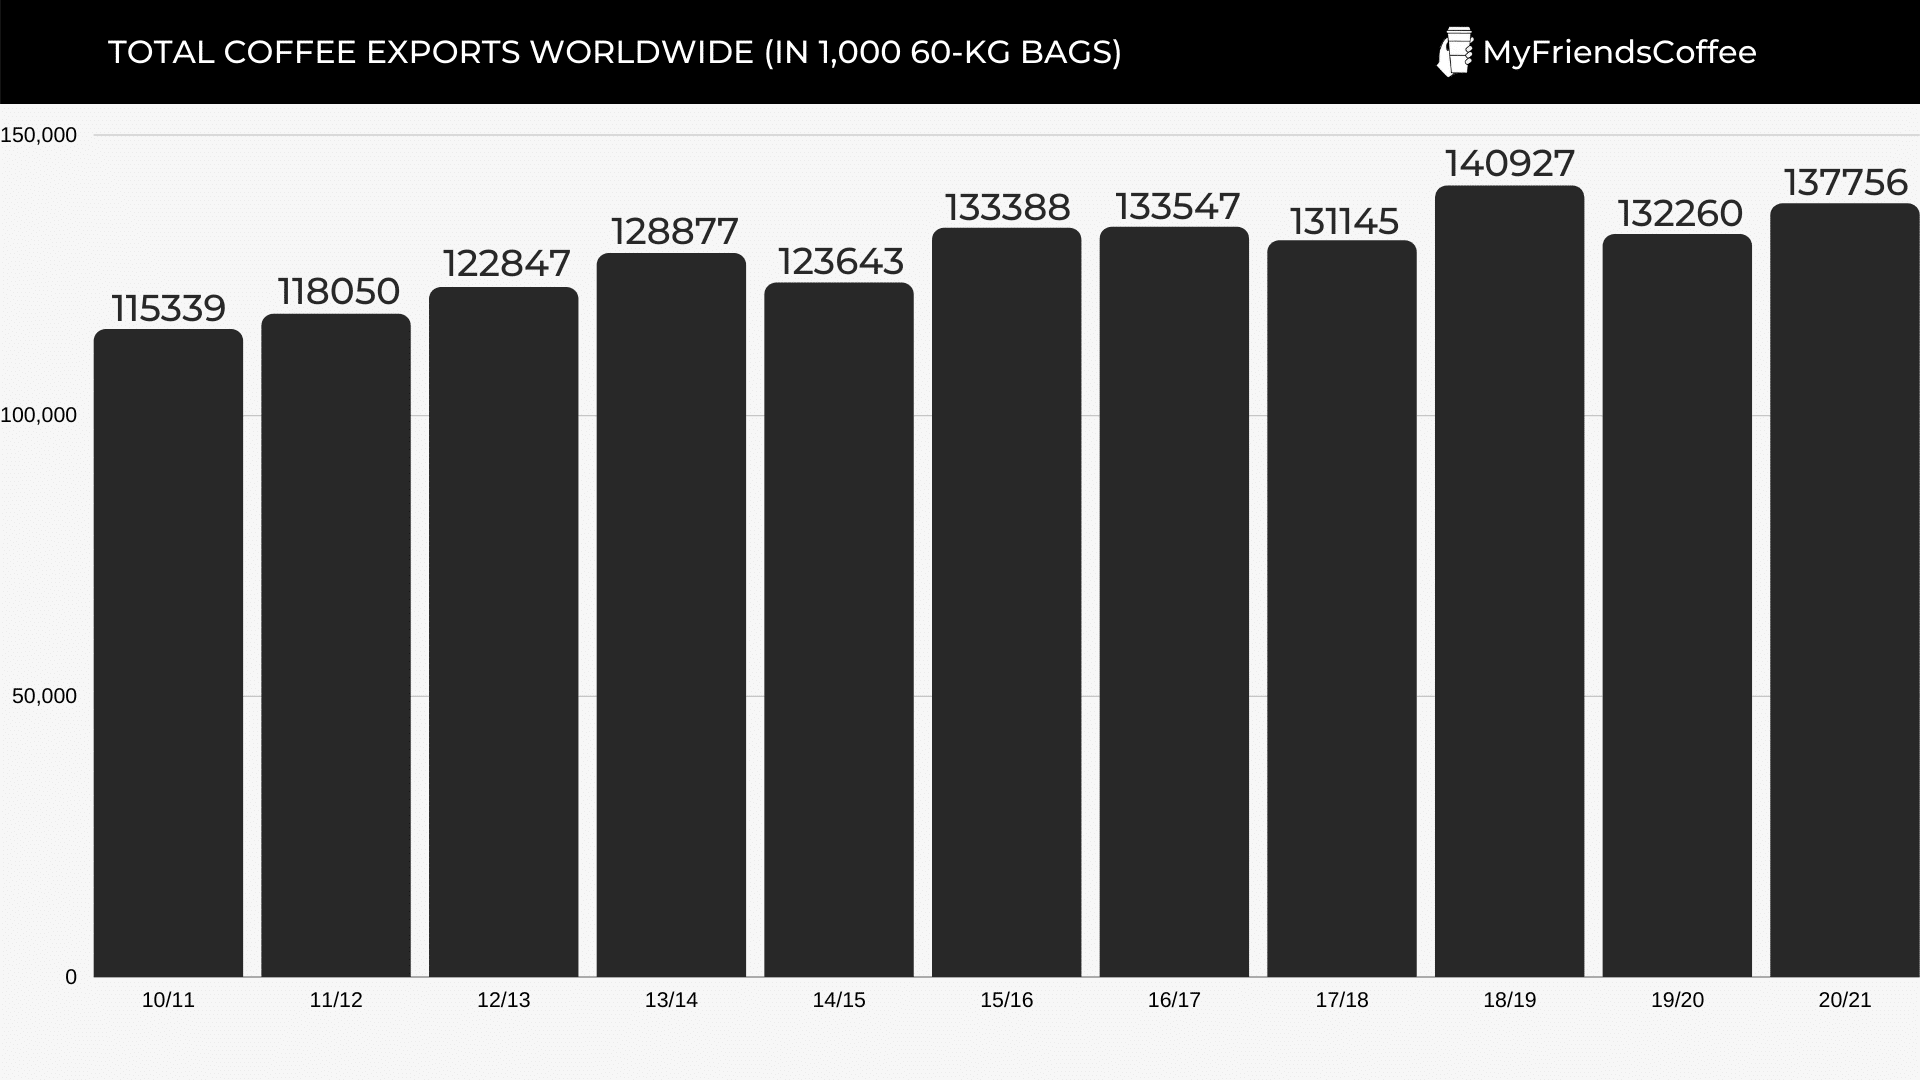
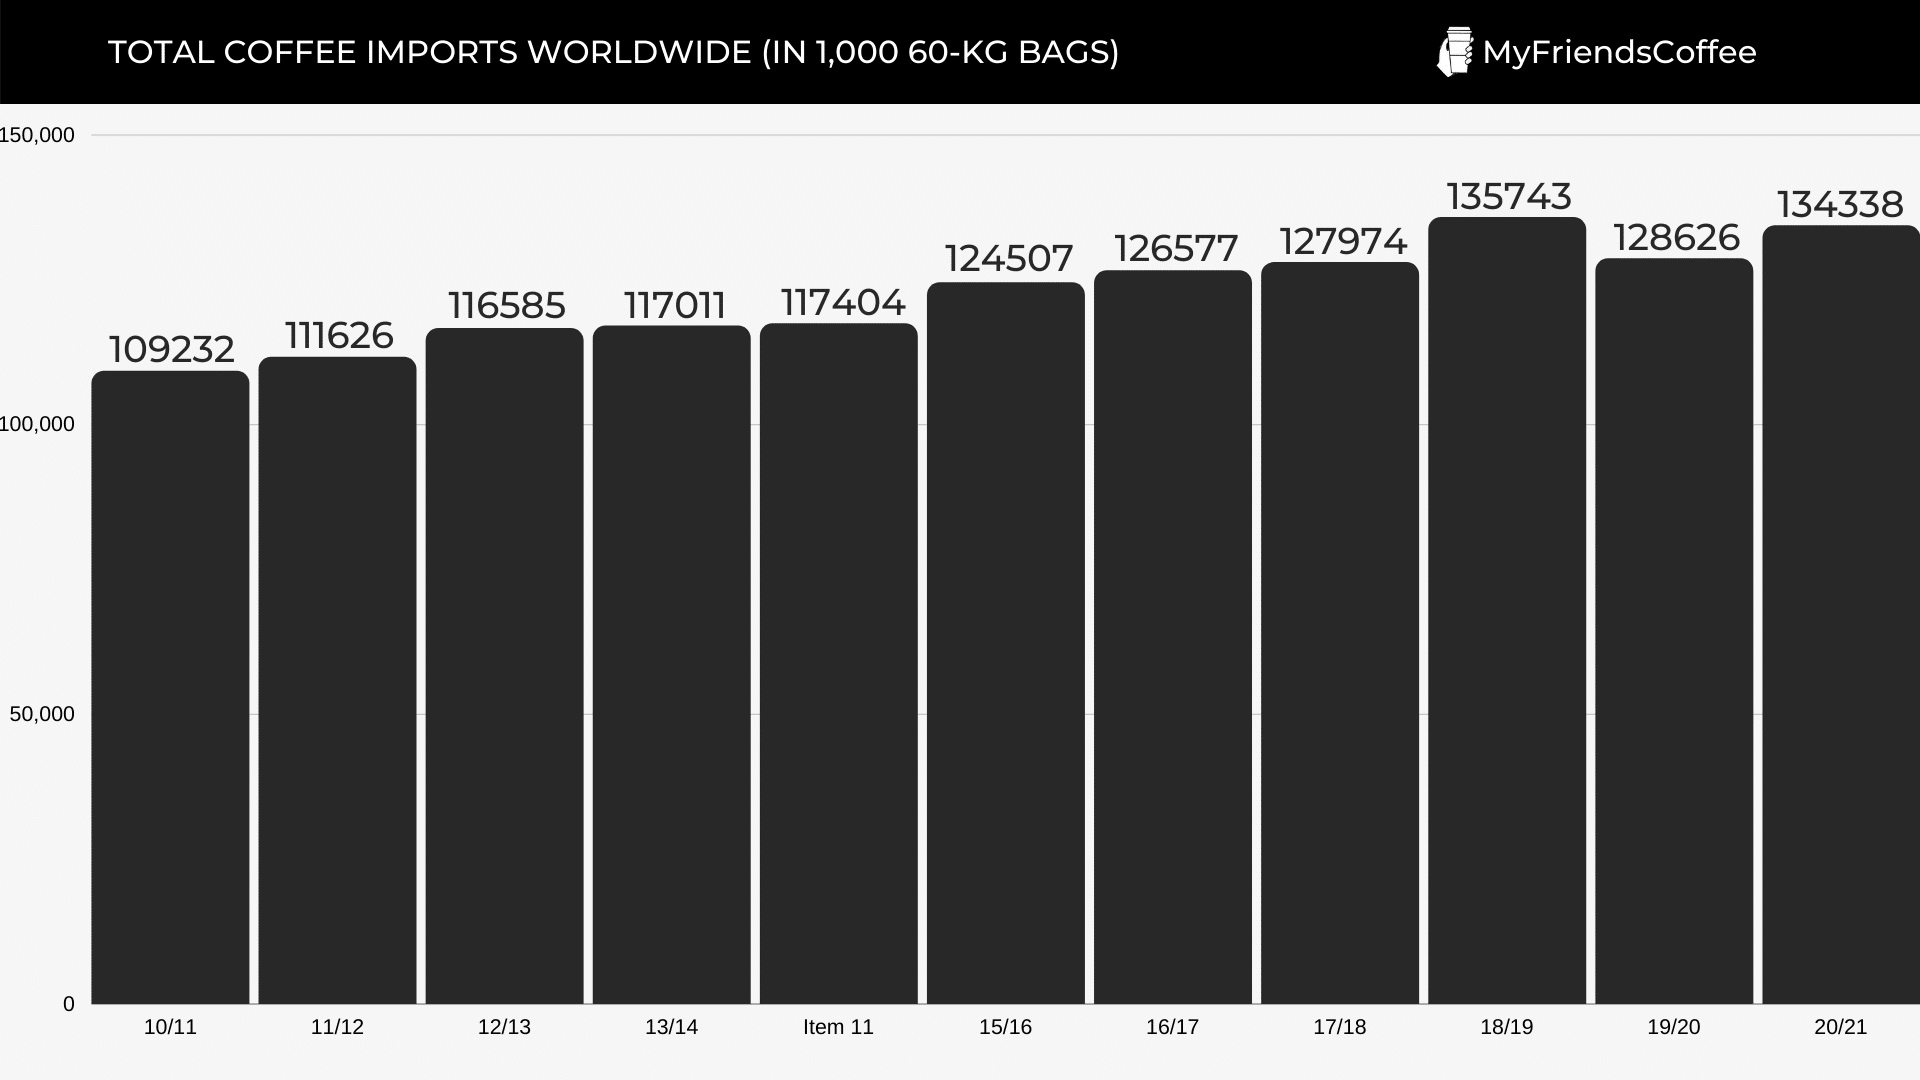
37. Total imports and exports of coffee from 2005-2020, in 1,000 60-kg bags (Statista):
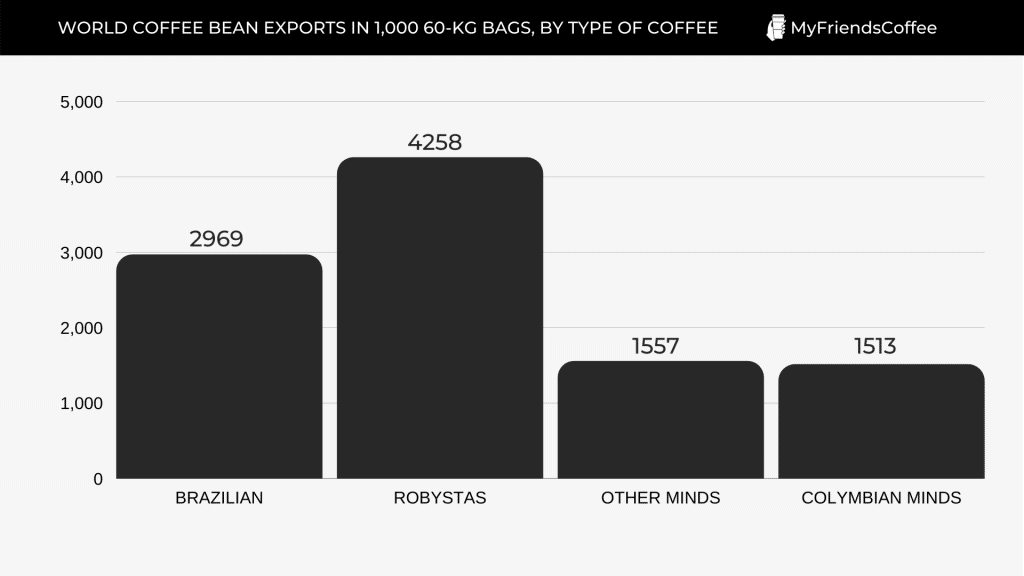
38. Worldwide export of types of coffee beans in 1,000 60-kg bags (Statista):
39. Countries with the highest import rate, in 60-kg bags (2016/17-2019/20) (International Coffee Organization):
| Coutry | 60-kg bags imported | Rate of increase |
| European Union | 46,082 | 1 % |
| USA | 27,732 | 2 % |
| Japan | 7,523 | 1 % |
| Russian Federation | 4,483 | 4 % |
| Canada | 3,846 | 2 % |
| Algeria | 547 | 24 % |
| South Korea | 2,447 | 6 % |
| Australia | 1,879 | 4 % |
| Saudi Arabia | 1,314 | 0 % |
| Turkey | 1,409 | 11 % |
| Ukraine | 1,204 | -1 % |
| Switzerland | 1,074 | -2 % |
| Norway | 904 | 0 % |
| Sudan | 592 | -3 % |
| Argentina | 574 | -5 % |
| Egypt | 633 | -1 % |
| South Africa | 646 | 7 % |
| Morocco | 730 | 3 % |
| Lebanon | 646 | 2 % |
| Taiwan | 718 | 8 % |
| Others | 9,388 | 4 % |
40. The total amount of imported coffee worldwide was 114,372 (in thousand 60-kg bags), and the average growth rate was 1.7% per year. (International Coffee Organization)
Coffee Shop Statistics
41. Largest coffee shops chains in the world (Wikipedia):
| Coffee shop name | Country founded in | Number of locations |
| Starbucks | United States | 28,218 |
| Dunkin’ | United States | 11,000 |
| Tim Hortons | Canada | 4,613 |
| Paris Croissant | South Korea | 3,558 |
| Costa Coffee | United Kingdom | 3,401 |
| Café Amazon | Thailand | 3,000 |
| Luckin Coffee | China | 1,700 |
| Café Coffee Day | India | 1,556 |
| Caffe Bene | South Korea | 1,378 |
| Doutor Coffee | Japan | 1,300+ |
| Krispy Kreme | United States | 1,005 |
| Ediya Coffee | South Korea | 1,000 |
| 85C Bakery Cafe | Taiwan | 994 |
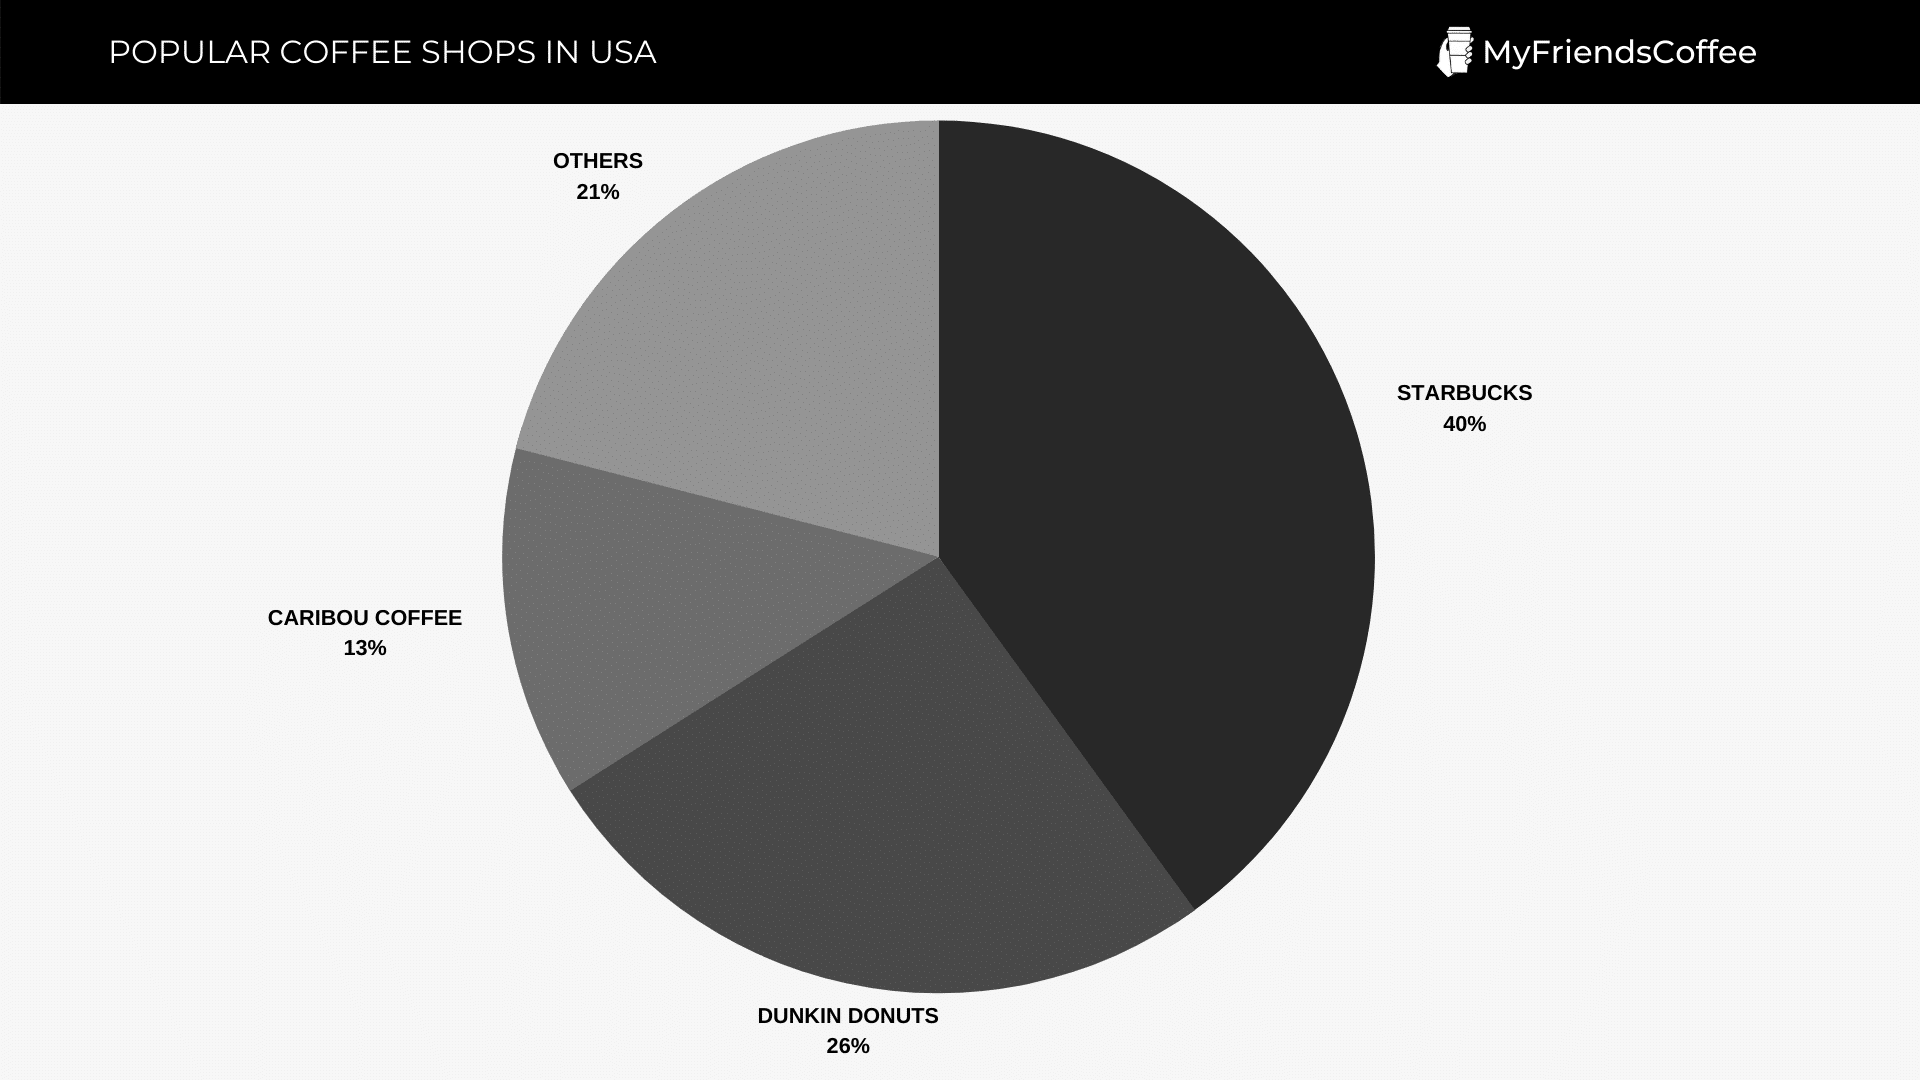
42. The most popular coffee shops in the USA (World Coffee Portal):
- Starbucks accounts for 40% of the entire coffee shop market, with approximately 14,875 stores.
- Dunkin’ Donuts occupies 26% of the coffee market and has approximately 9,570 stores throughout the United States.
- Caribou coffee occupies 13% of the coffee shop market and has approximately 4,700 stores in the USA.
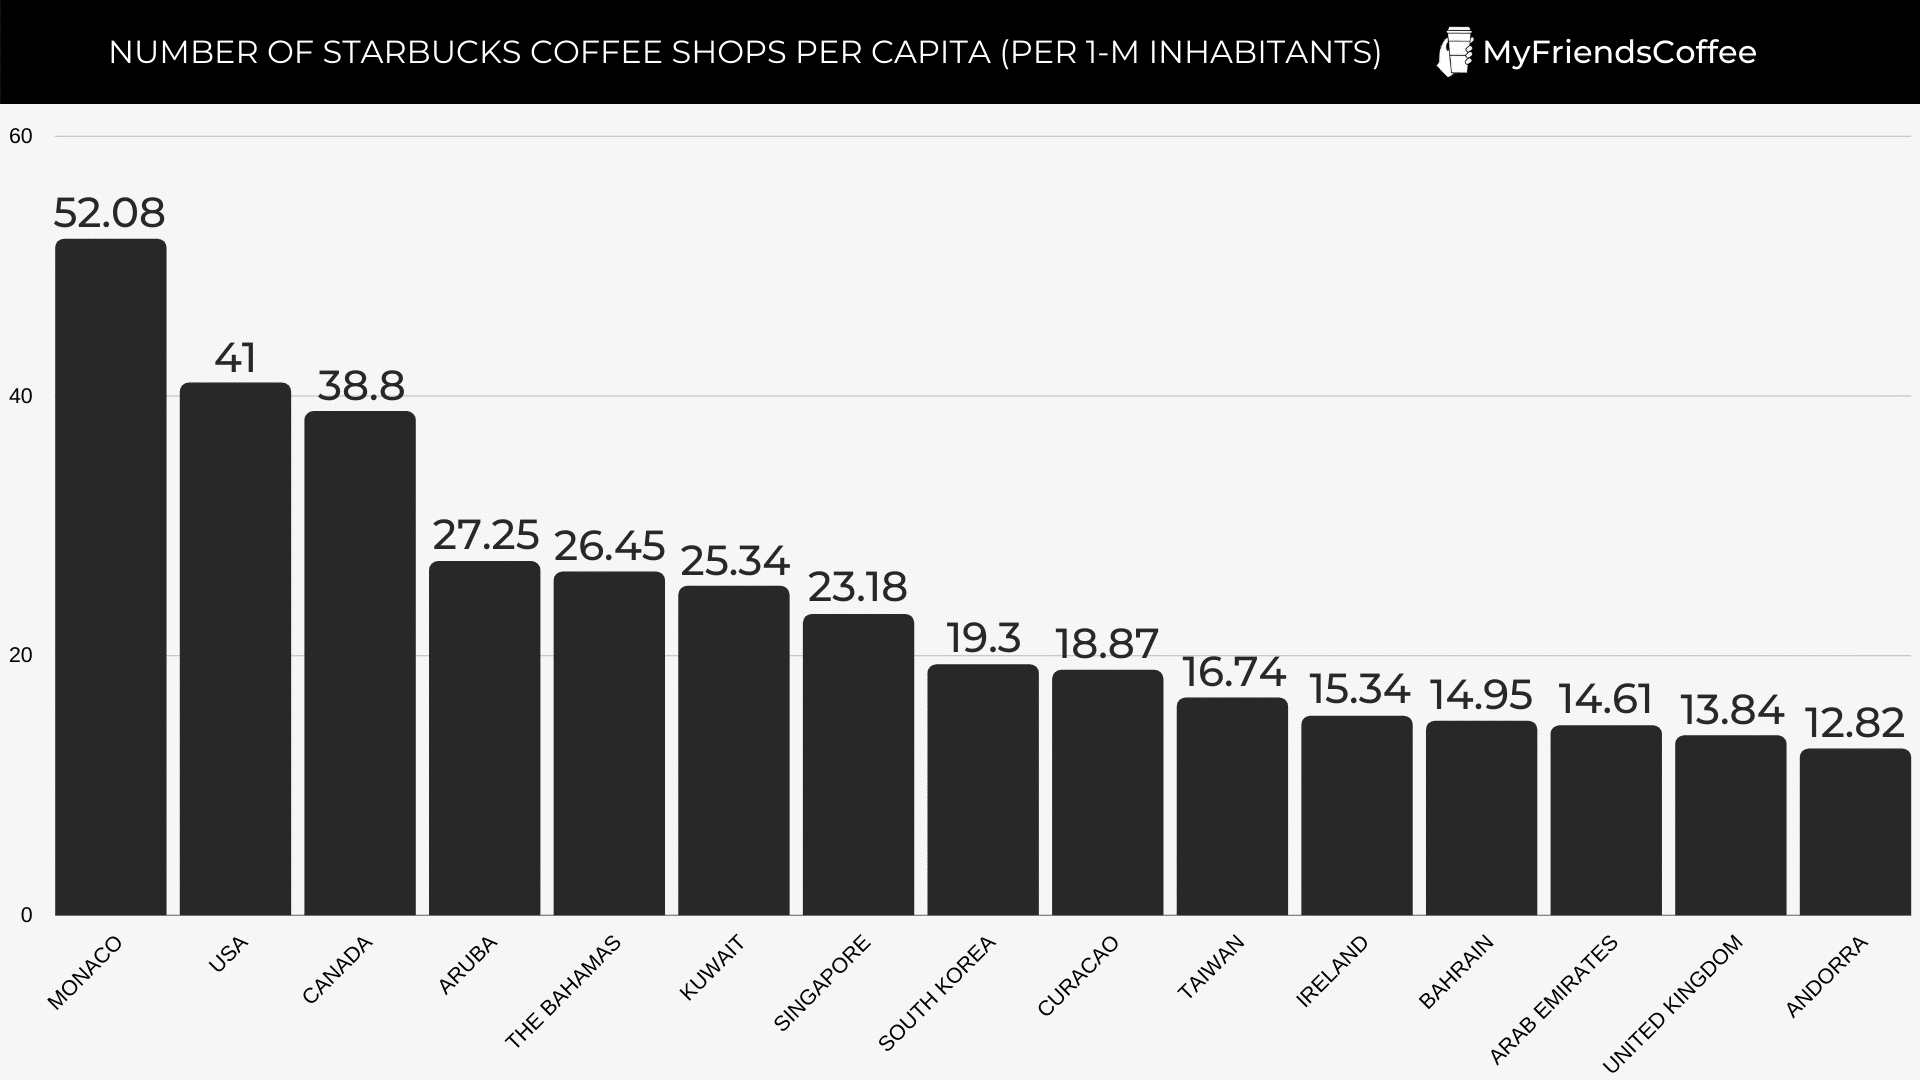
43. The number of Starbucks coffee houses per capita by country, per 1 million inhabitants (The Telegraph):
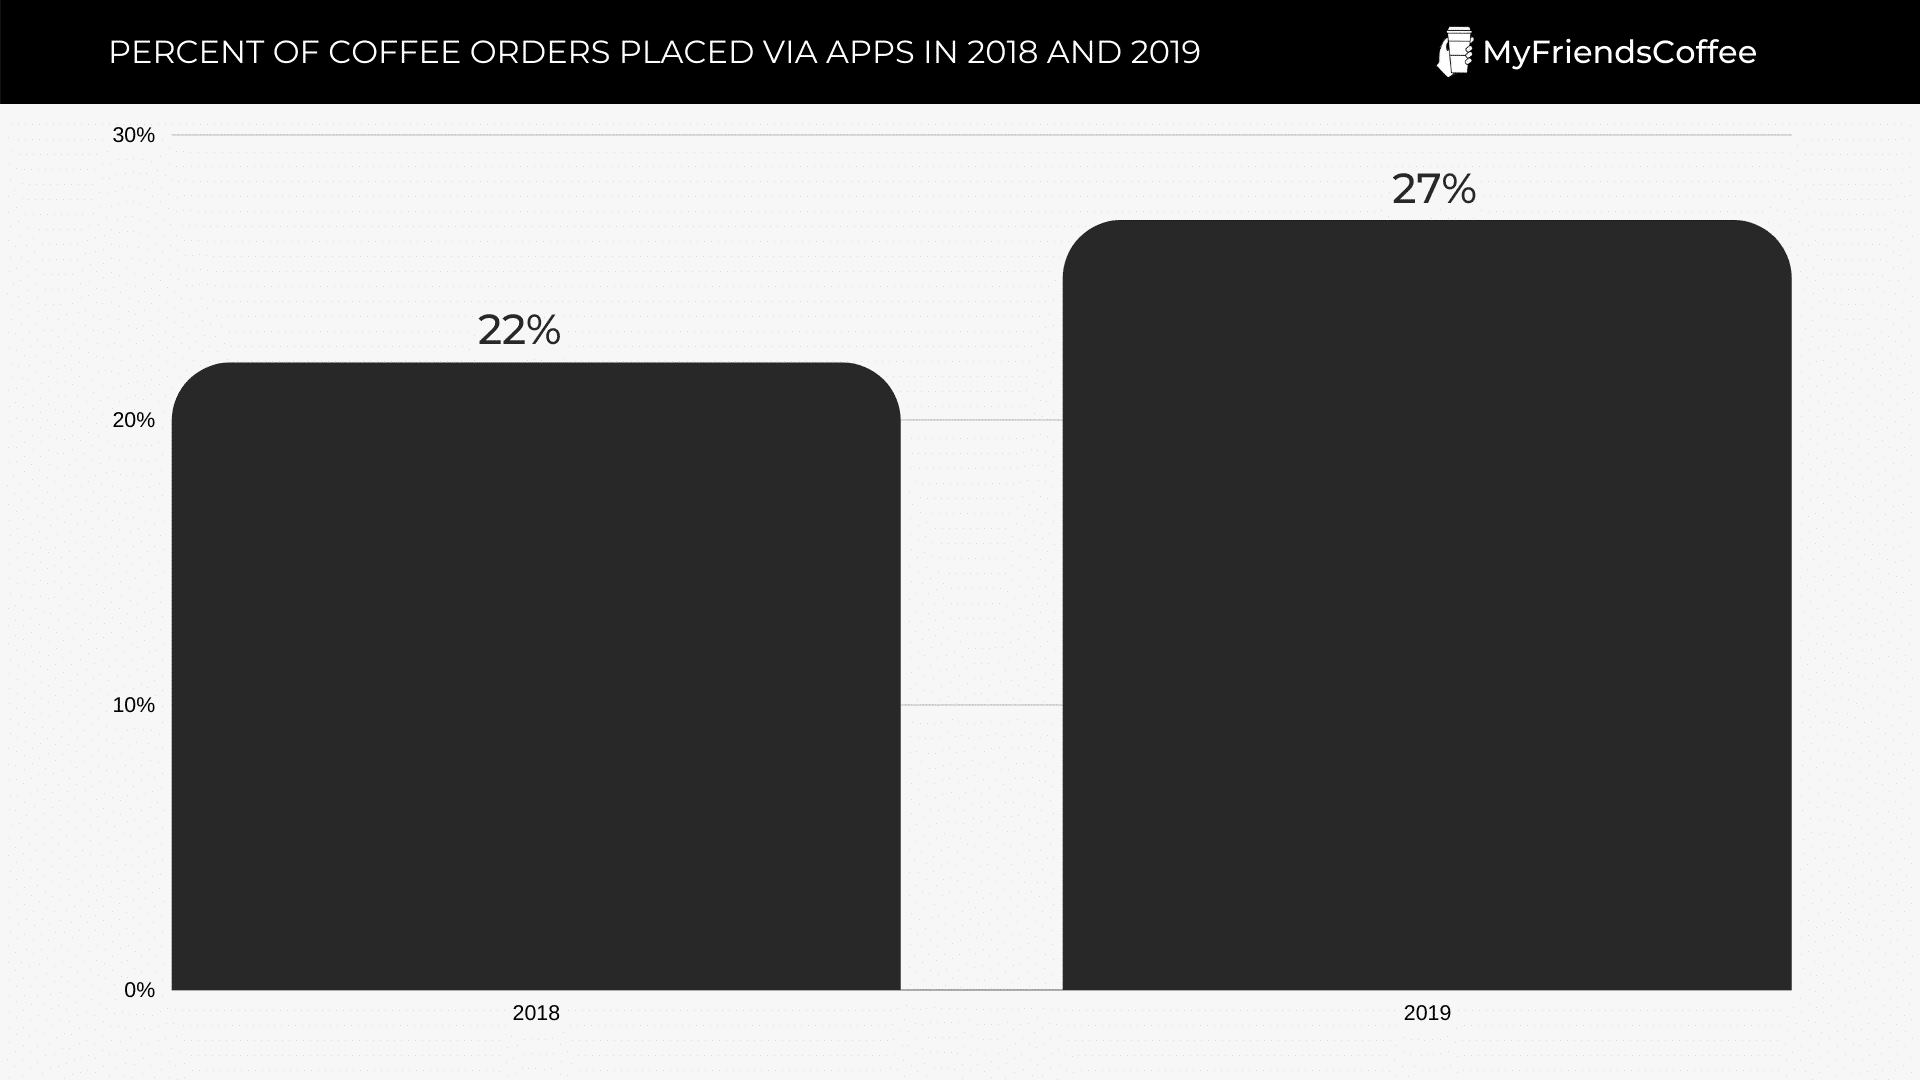
44. At Starbucks, 20% of total orders are placed through mobile apps. (RetailDive)
45. The use of apps to order coffee in 2018 versus 2019 (Statista):
Coffee Industry Revenue Statistics
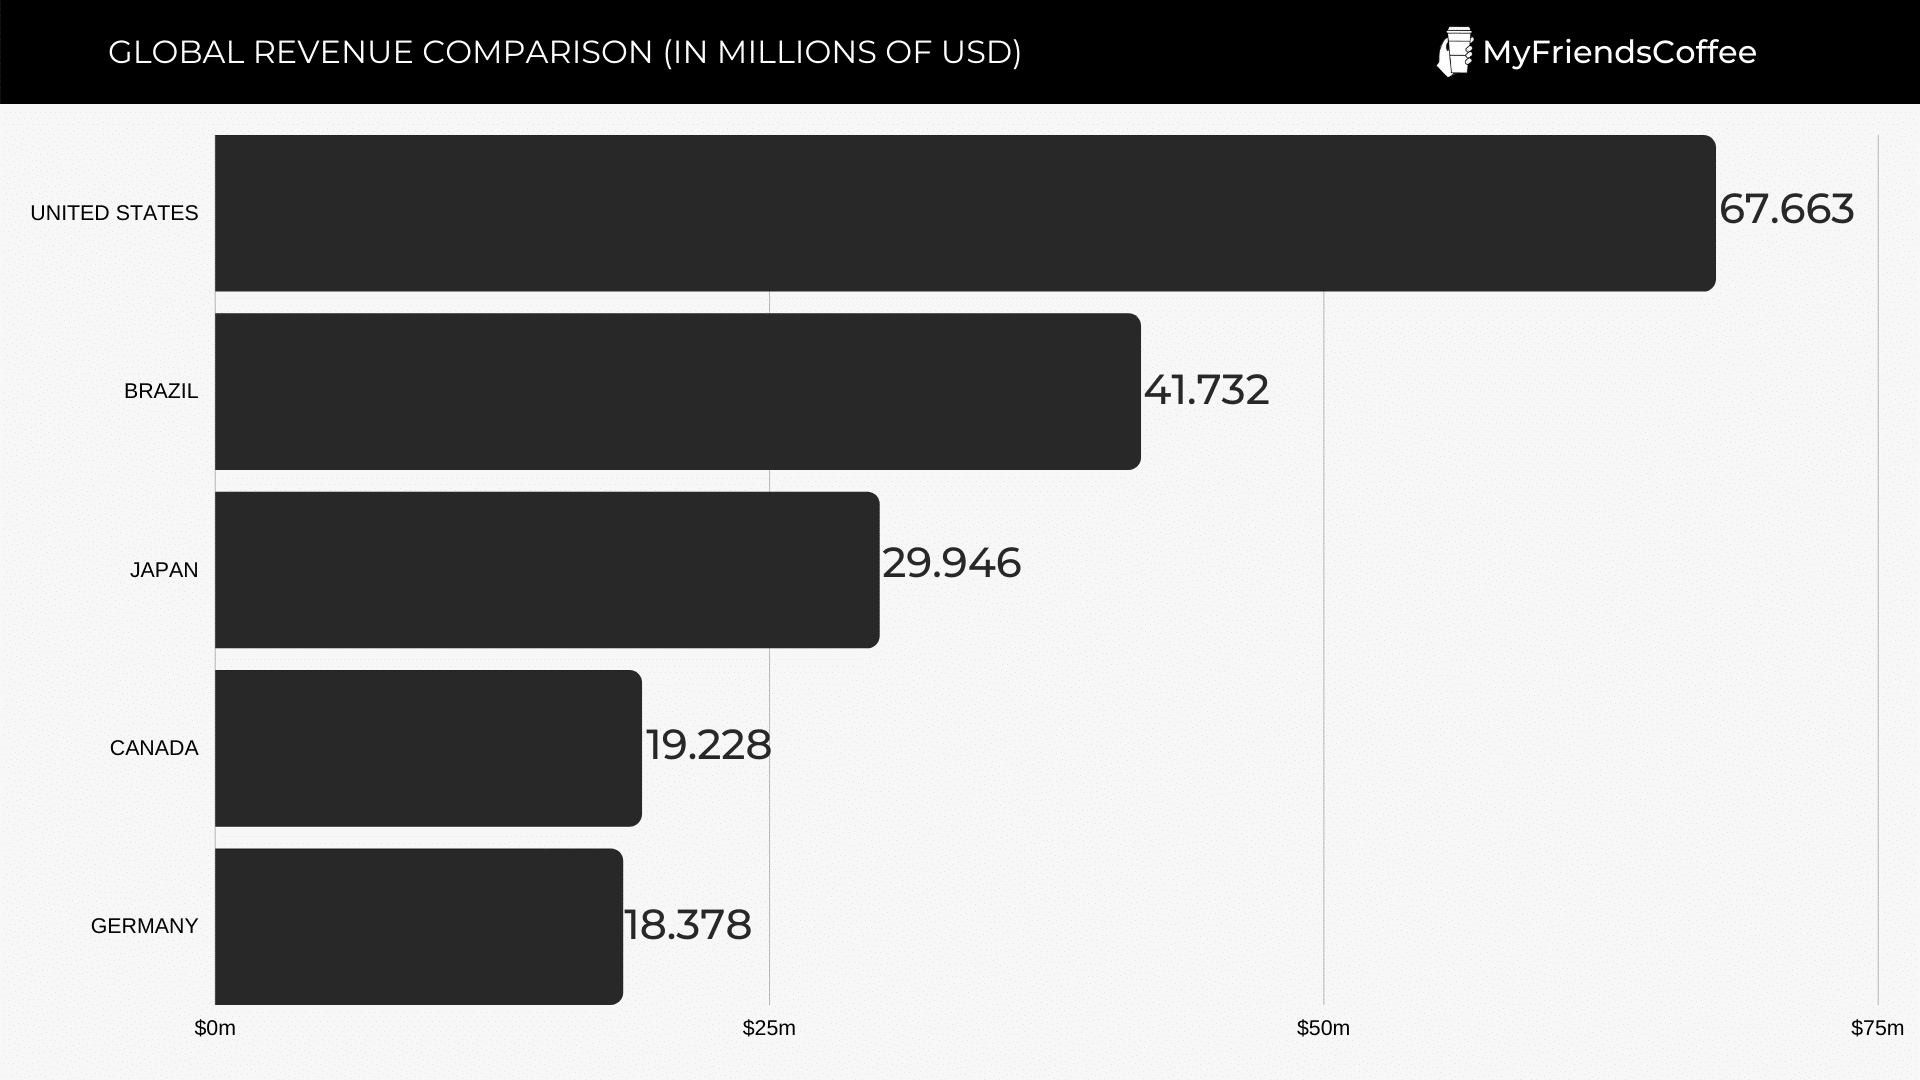
46. Countries with the highest income in the coffee industry (Statista):
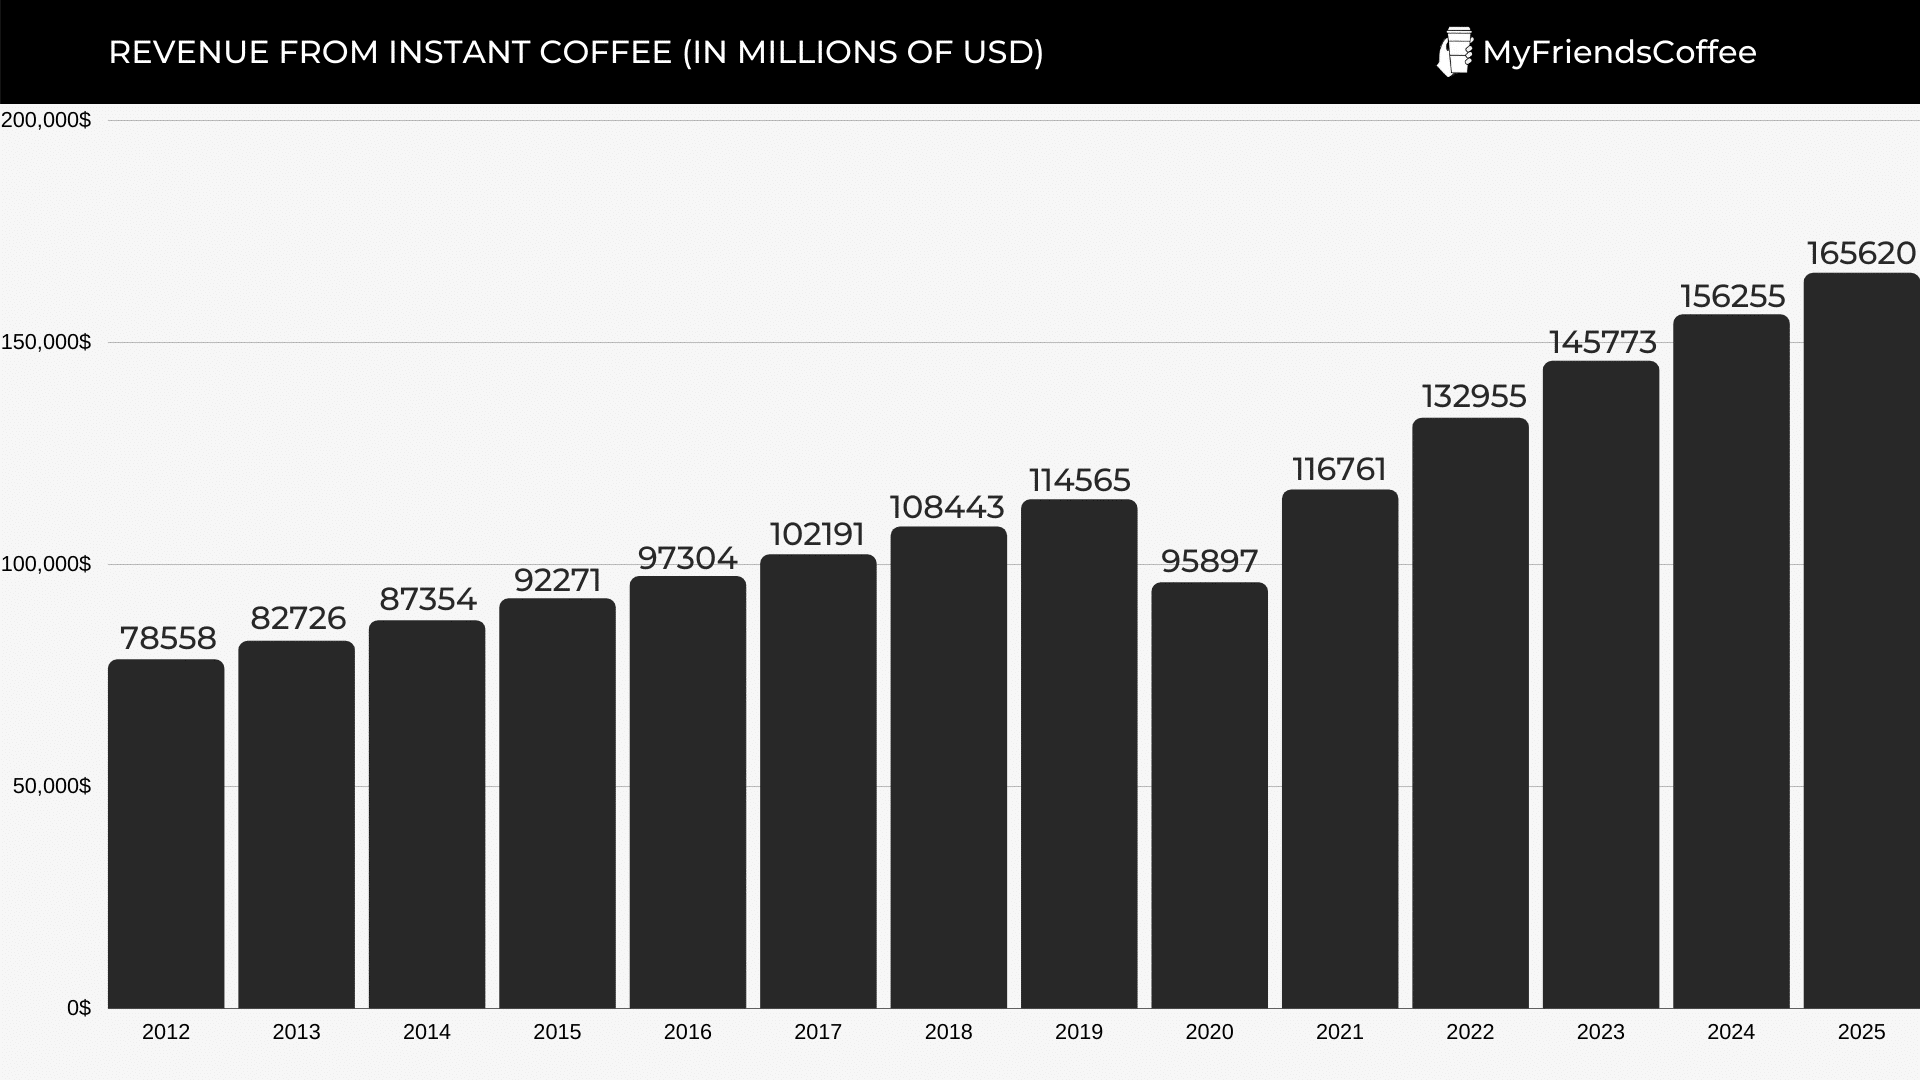
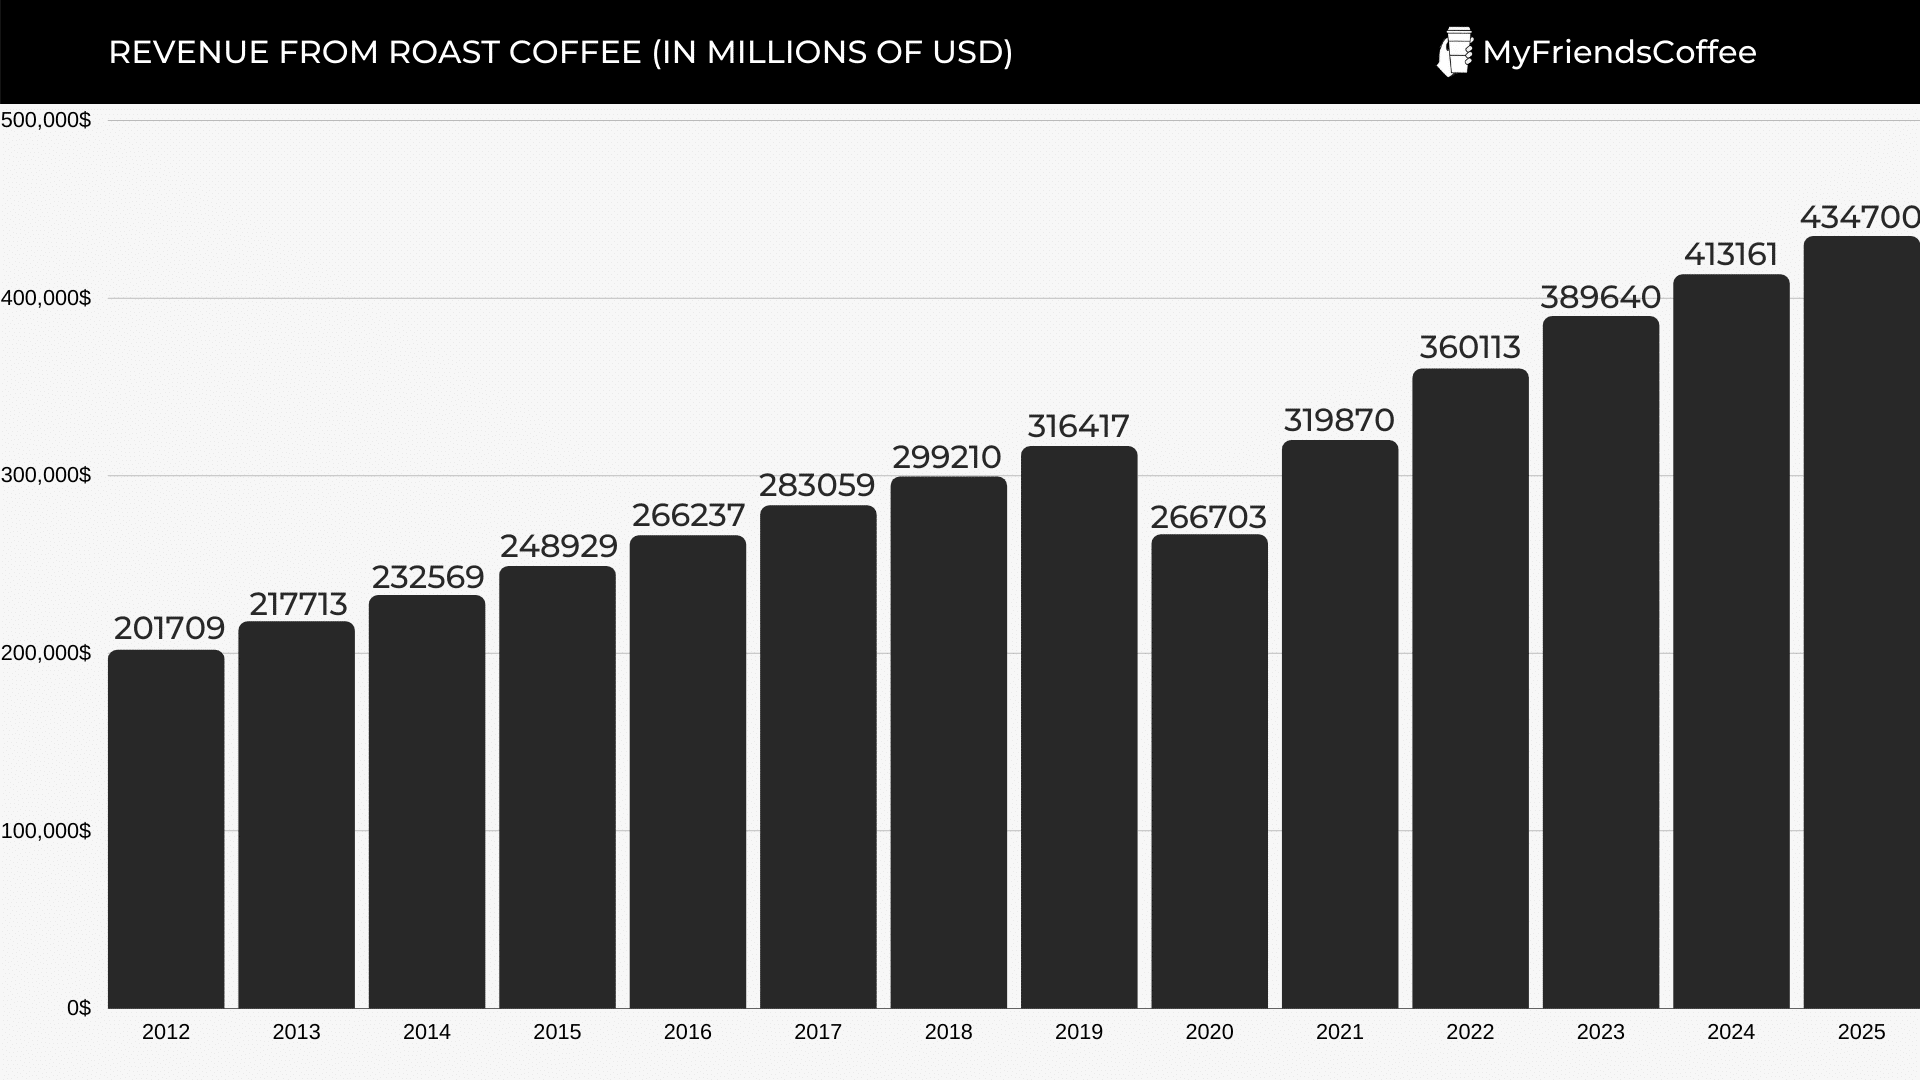
47. Revenue by coffee type in millions of USD from 2012 to 2025 (projected) (Statista):
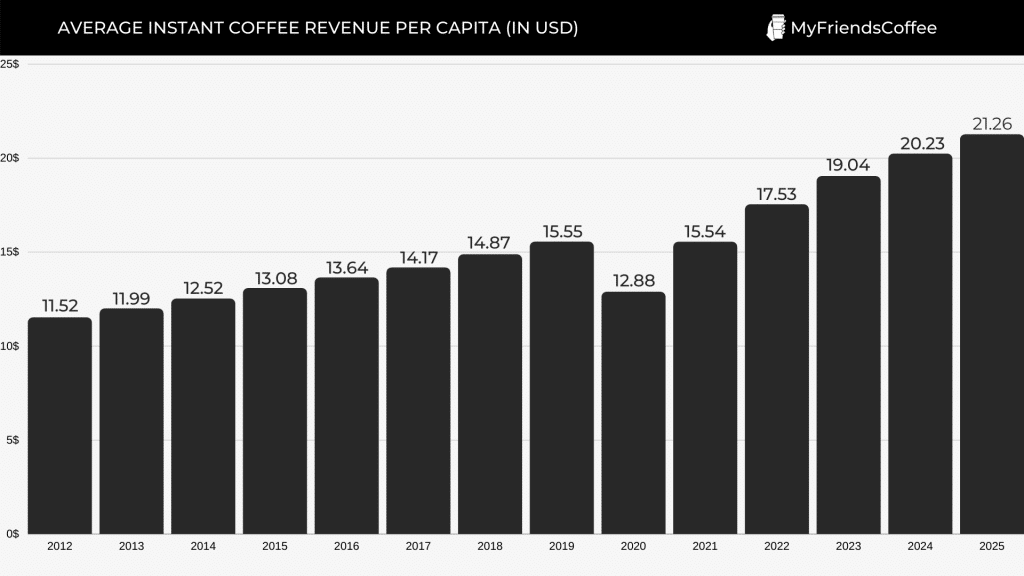
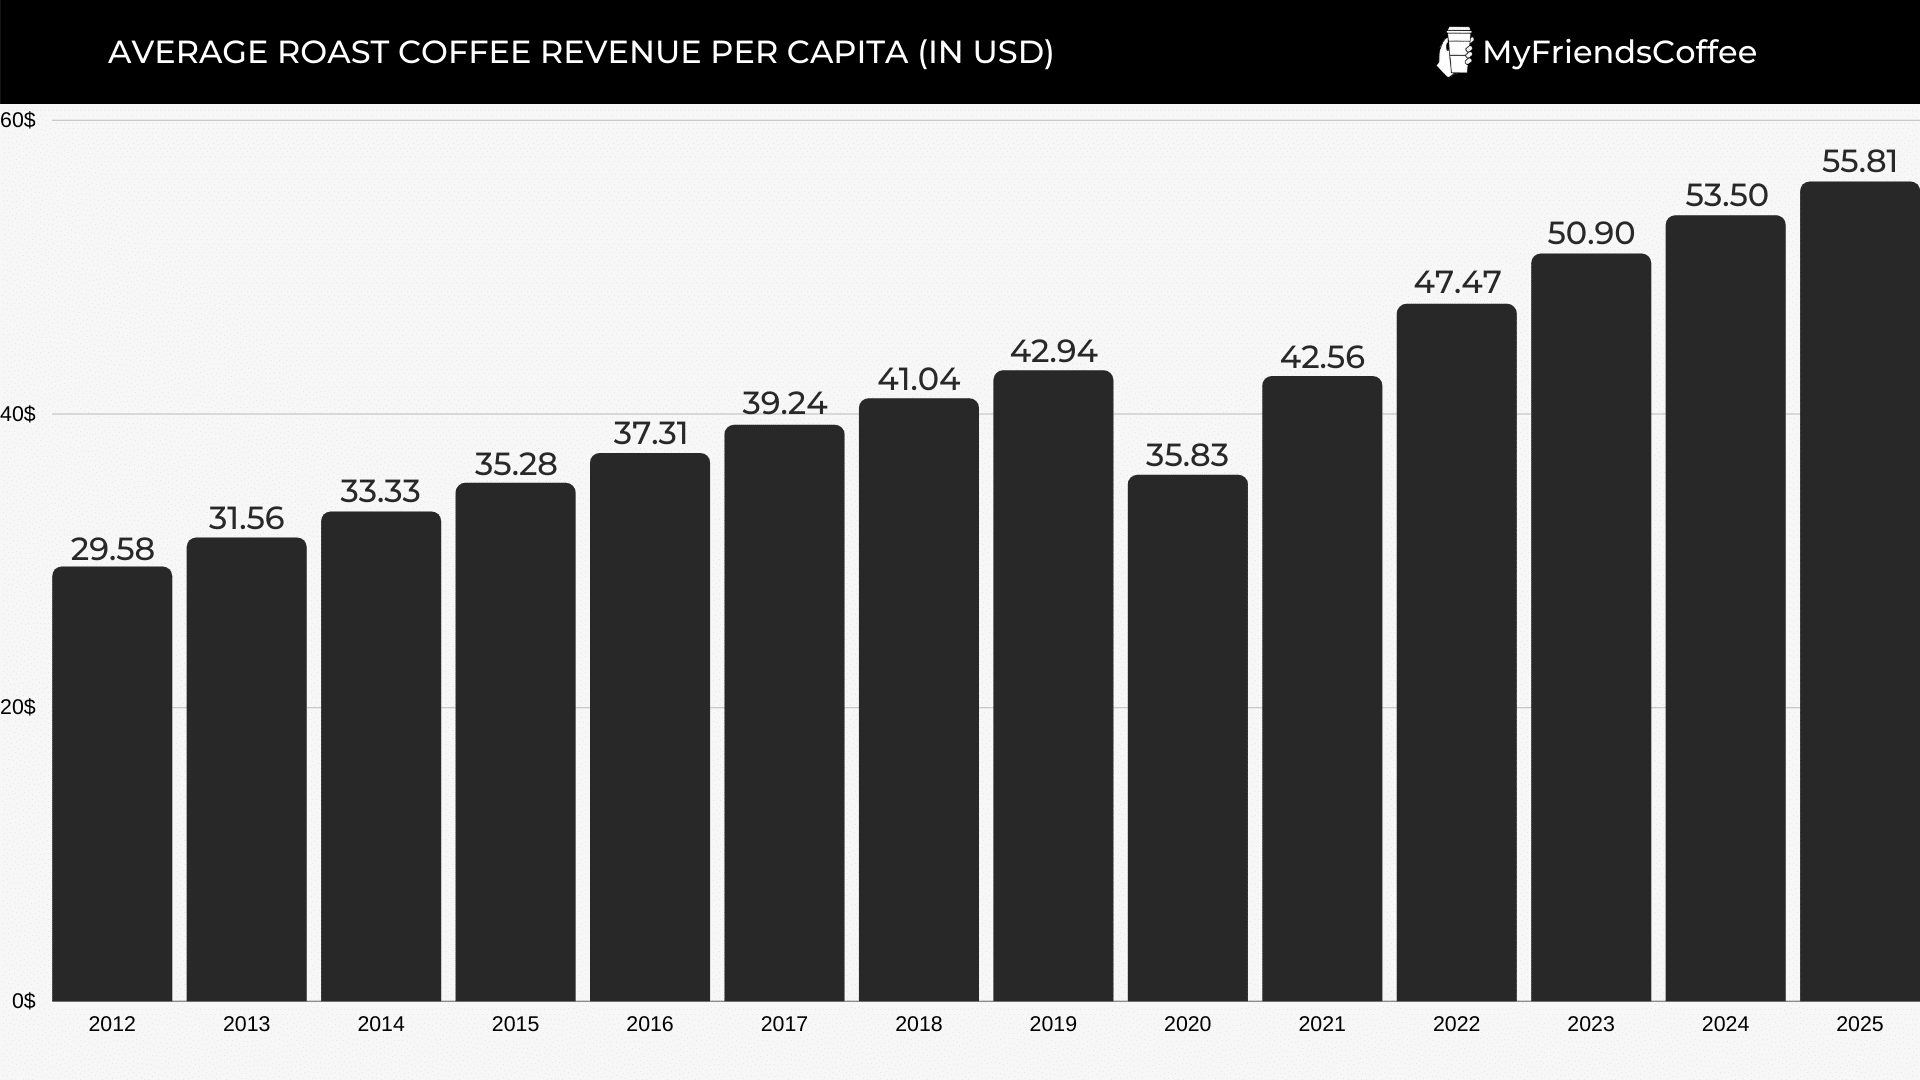
48. Average revenue per capita in USD from 2012 to 2025 (projected) (Statista):
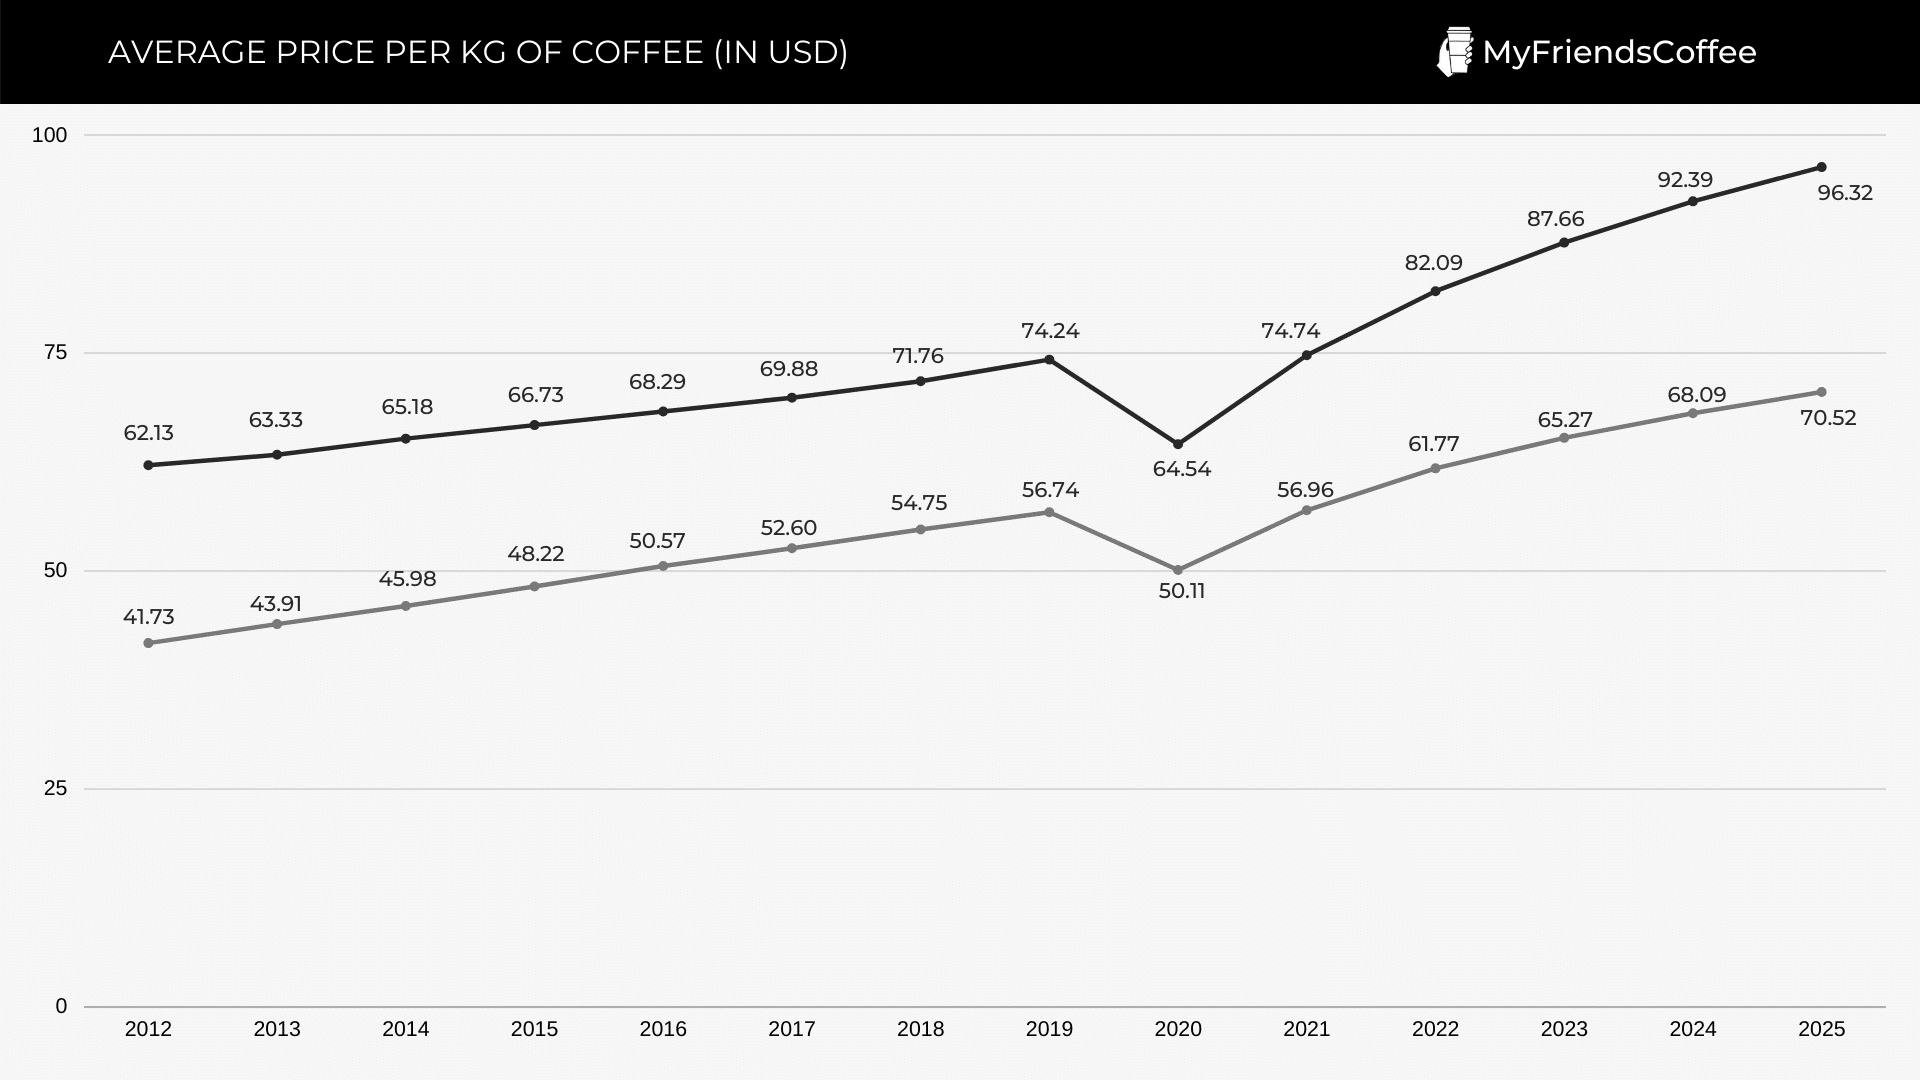
49. Average price per kilogram of coffee in USD from 2012 to 2025 (projected) (Statista):
Upgrade Your Coffee Game
For those looking for the freshest, highest-quality beans, we recommend checking out our list of the best ones. To compile the list, we studied the coffees used by popular restaurants and cafés. We paid attention to cultivation and processing methods, the quality of the beans, and their roasting profiles. We evaluated the roasting, packaging, and how fresh the beans were on delivery.
Check out our list of the best espresso beans. You will find both 100% Arabica single-origin coffee and blends, and a range of roasts, from light roasts to French roasts. There's a great option for everyone.
We also know that to brew a delicious espresso with a dense body and a great crema, you need fresh beans. Therefore, our list contains coffee that can be ordered directly from roasters.
If you're experiencing heartburn, acid reflux, or other digestive issues but don't want to give up coffee, check out our list of the best low-acid beans. The list only contains coffees that are naturally low in acidity or are roasted using special technology. To evaluate the beans' flavor potential, we brewed each of the coffees on the list with a different brewing method.
If you're looking for beans grown without the use of chemicals, we recommend checking out our list of the best organic coffee. The list contains only organic beans cultivated with special care without chemical fertilizers or pesticides. And we made sure to evaluate freshness and taste, so on the list you'll find options that can be ordered directly from roasters.
For those looking to expand their coffee experience with something special, we recommend checking out our list of the best Kona coffee. This variety is only grown on the Big Island of Hawaii.
On our list, you'll find 100% Kona coffees that have certificates or awards of provenance. This is important because Kona's popularity and high price means there are many scammers who pass off blends of unknown beans as Kona coffee.
